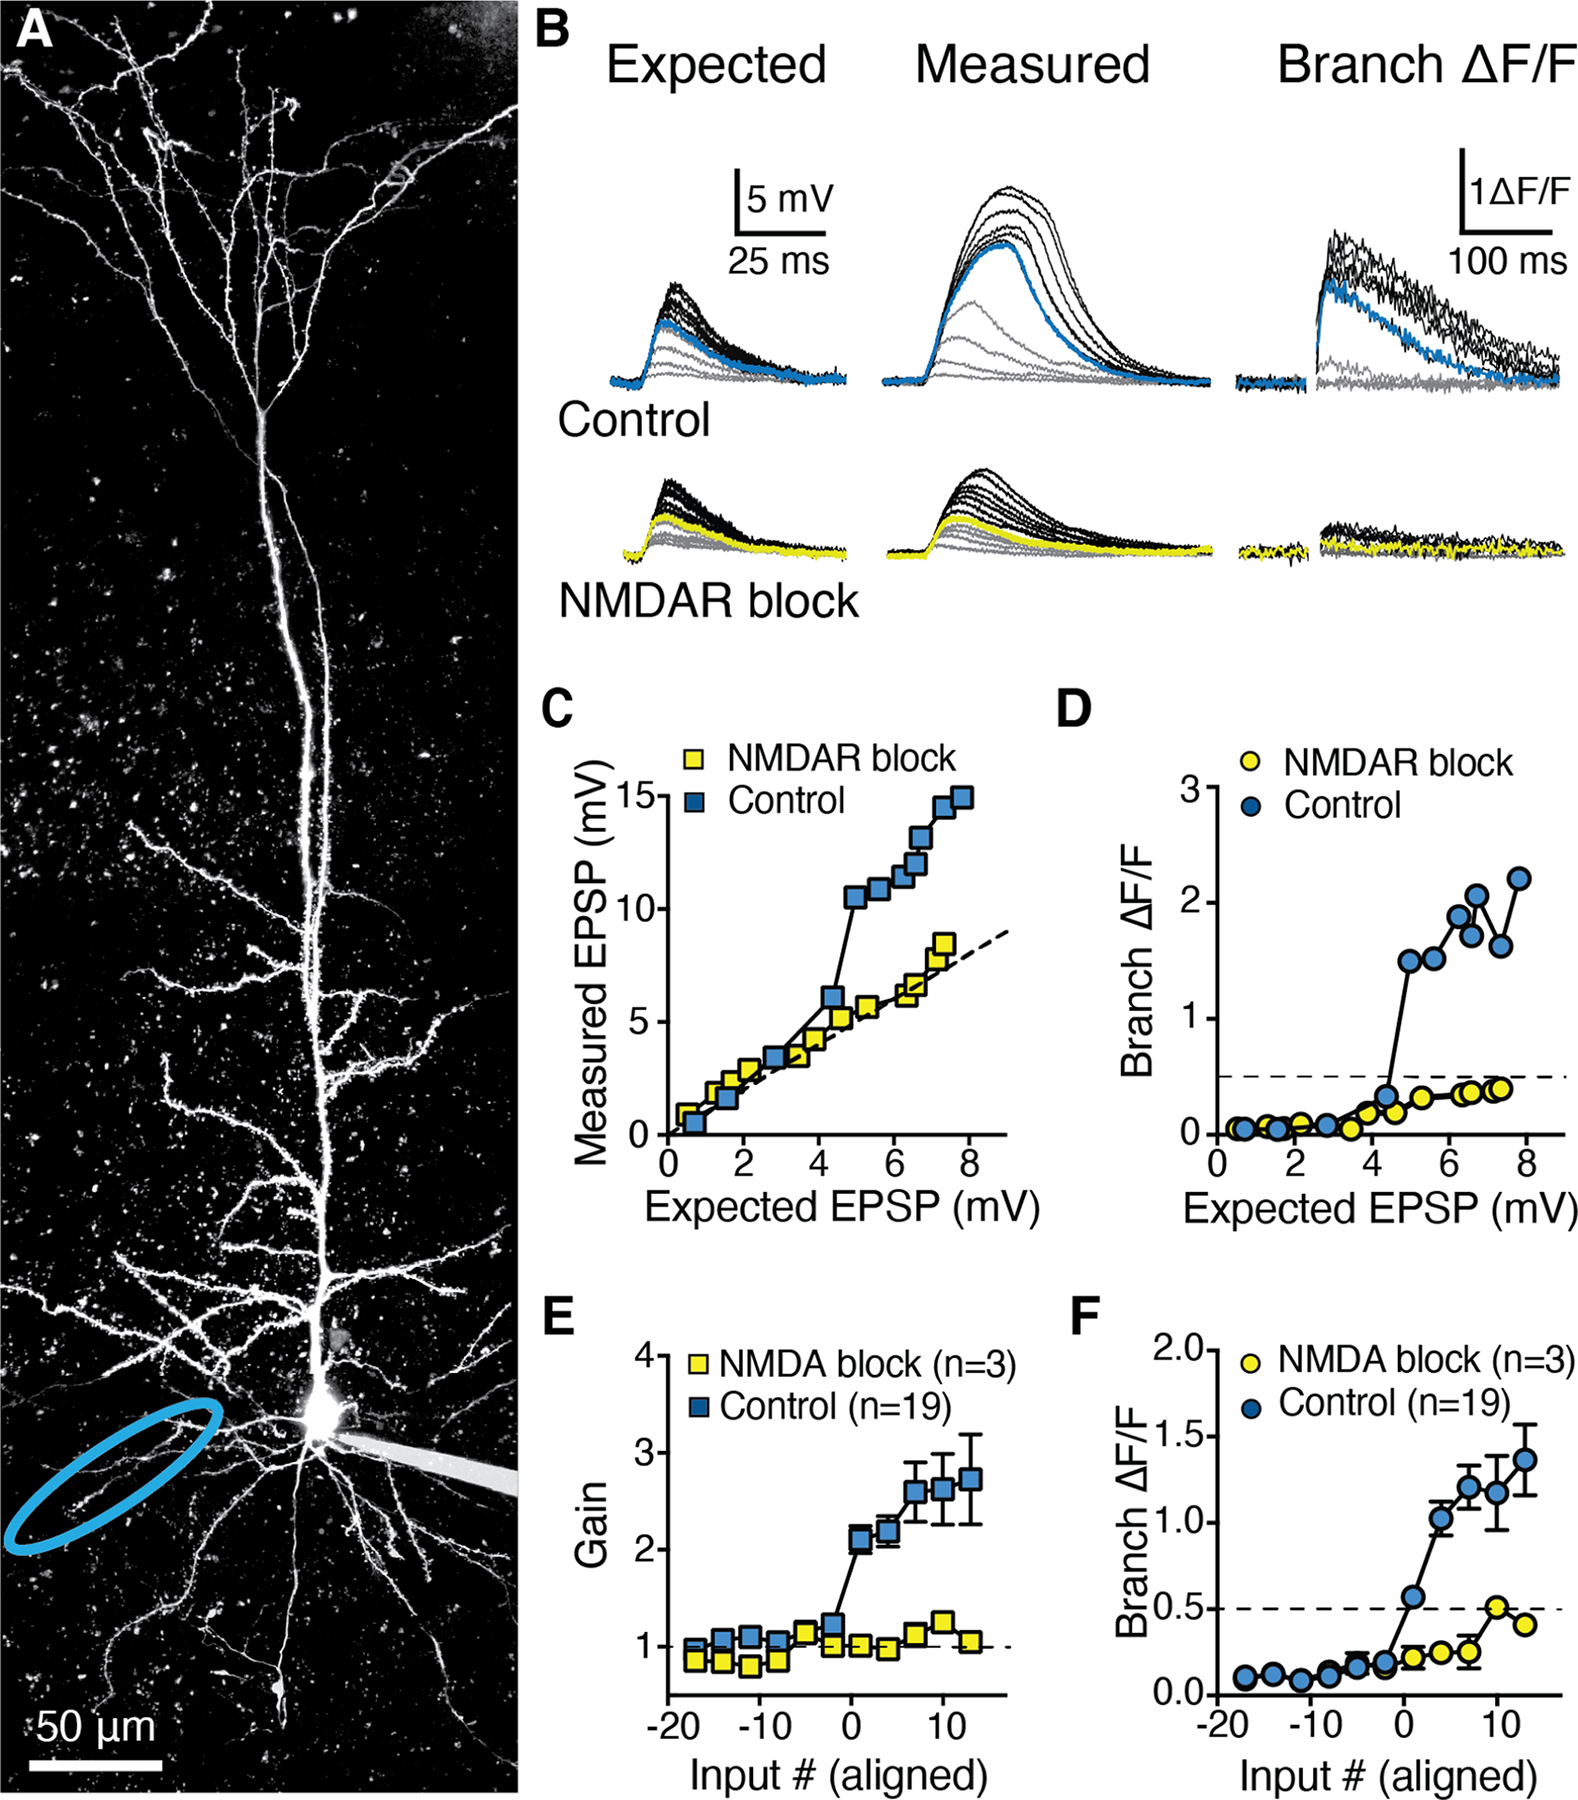
Figure 3: Highly supralinear integration in basal dendrites of RSC A30 L5b PCs mediated by NMDARs.

A, Two-photon z-stack of a L5b RSC A30 PC filled via somatic patch pipette with Alexa-594. B, Top: Expected uEPSPs calculated as the linear sum of somatic responses to glutamate uncaging at individual spines (left) versus measured uEPSPs recorded at the soma (middle) and local branch OGB-6F Ca2+ signals (right) for synchronous uncaging at increasing numbers of inputs. Blue traces indicate supralinear threshold (>50% ΔF/F) number of inputs in control conditions. Bottom: same as top, but in the presence of D-APV (50 μM) and MK-801 (10 μM) for the same branch. Yellow traces indicate the previous supralinear threshold from top. C, Measured uEPSP amplitude and D, Local branch ΔF/F, both as a function of expected uEPSP amplitude in control condition (blue) and in presence of NMDAR blockers (yellow) for the branch and traces shown in A and B. Dashed line indicates linearity (C) and supralinearity threshold (50% ΔF/F; D). E, Population input-output gain in control condition (blue squares, 19 basal branches from 14 neurons) and in presence of NMDAR blockers (yellow squares, paired experiments in 3 basal branches from 3 neurons), aligned by threshold number of inputs (>50% ΔF/F local branch Ca2+). See also Figure S4. F, Corresponding population branch Ca2+ signal in control condition and in presence of NMDAR blockers. Data points in E and F are mean±sem.
