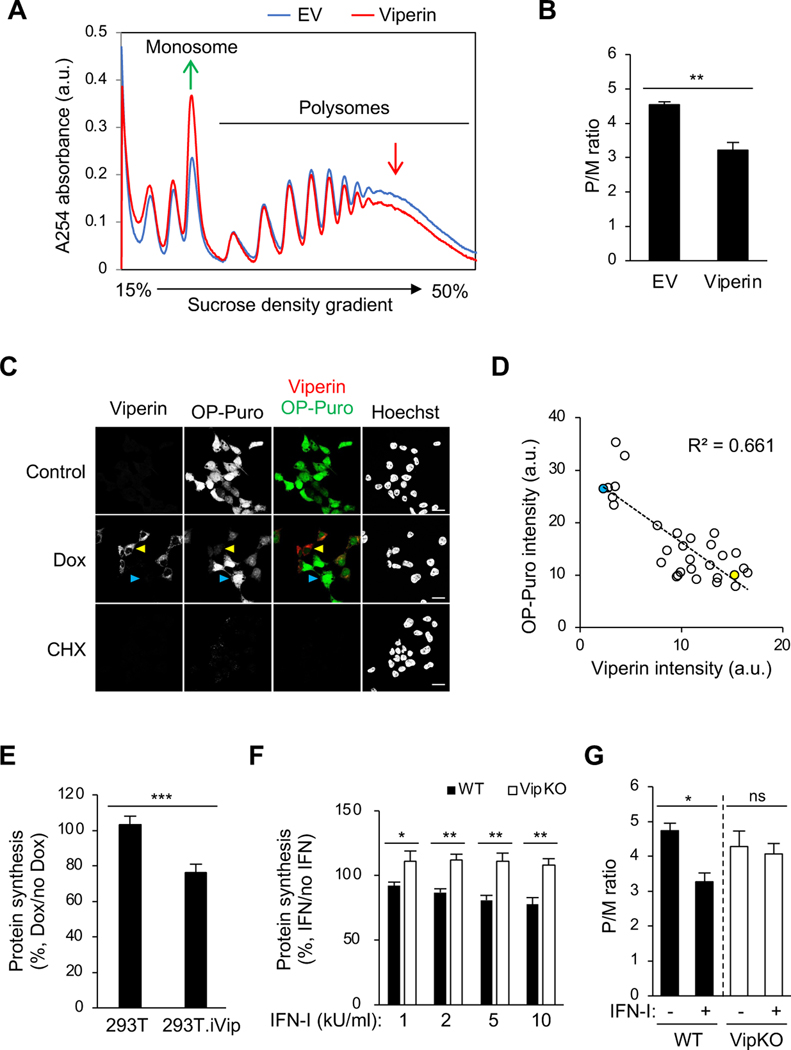
Figure 2. Viperin inhibits translation.
(A) Polysome profile analysis of viperin-transfected 293T cells. Cell were transfected with plasmid encoding viperin for 24 h. Cell lysates were cleared by centrifugation, loaded onto a 15–50% sucrose gradient, and subjected to ultracentrifugation. Absorbance was monitored at 254 nm to record the polysome profile. The monosome and polysome pools are indicated. EV, empty vector. a.u., arbitrary unit.
(B) Quantification of polysome profile assay in (A). Data are represented as the polysome-to-monosome (P/M) ratio.
(C) Global protein synthesis analysis by O-propagyl puromycin (OP-Puro) labeling and confocal microscopy in 293T.iVip cells. Cells were treated with Dox, stained by OP-Puro labeling and anti-viperin antibody, and then analyzed by confocal microscopy. High and low viperin expressing cells were indicated by yellow and cyan arrow heads, respectively. Scale bars, 20 μm.
(D) Scatter plot of viperin and OP-Puro fluorescence intensities from individual cells (n=30; R2=0.661). Yellow and cyan dots represent the high and low viperin expressing cells, respectively, as shown in (C). a.u., arbitrary unit.
(E) Global protein synthesis analysis by OP-Puro labeling and flow cytometry analysis in 293T.iVip cells. Cells were treated with Dox, stained by OP-Puro labeling, and analyzed by flow cytometry. Data represent the mean fluorescence intensity ratio between Dox-treated and mock treated cells.
(F) Global protein synthesis analysis by OP-Puro labeling and flow cytometry analysis in immortalized mouse bone marrow-derived macrophage (iBMDM) cell lines from wildtype (WT) and viperin knockout mice (VipKO). Cells were treated with type I interferon (IFN-I) for 18 h, stained by OP-Puro labeling and analyzed by flow cytometry. Data represent the mean fluorescence intensity ratio between IFN-I-treated and mock treated cells. kU, kilounit.
(G) Quantification of polysome profile assay of the IFN-I responses in iBMDM and iBMDM.VipKO cells. Cells were treated with IFN-I for 8 h and analyzed by sucrose density gradient velocity sedimentation. Data are represented as the polysome-to-monosome (P/M) ratio.
For (B) and (E-G), data are shown as mean ± SD of three biological repeats (n = 3). *p < 0.05, **p < 0.01, ***p < 0.001 by unpaired Student’s t test. ns, not significant.

