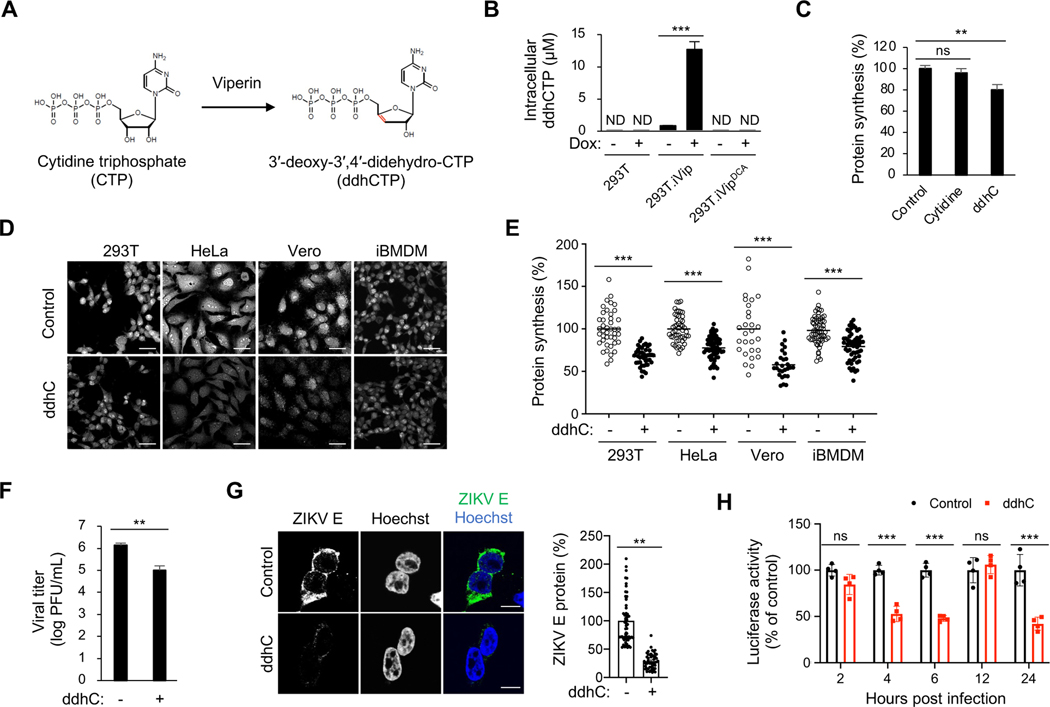
Figure 4. Viperin’s enzymatic product induces translation inhibition.
(A) Viperin catalyzes the conversion of cytidine triphosphate (CTP) to 3′-deoxy-3′,4′-didehydro-CTP (ddhCTP) (Gizzi et al., 2018).
(B) ddhCTP formation in 293T.iVip and 293T.iVipDCA cells. Cells were treated with Dox for 24 h and analyzed by mass spectrometry. ND, not detected.
(C) Global protein synthesis analysis by OP-Puro labeling and flow cytometry analysis in 293T cells. Cells were treated with cytidine or alcoholic form of ddhCTP (ddhC) for 24 h, stained by OP-Puro labeling and analyzed by flow cytometry. Data represent the mean fluorescence intensity ratio between treated and mock treated cells (Control).
(D) Global protein synthesis analysis in tissue culture cells. Cells were treated with ddhC for 24 h, stained by OP-Puro labeling and analyzed by confocal microscopy. Scale bars, 50 μm.
(E) Quantification of OP-Puro fluorescence intensity from individual cells shown in (D). Data represent the mean fluorescence intensity ratio between ddhC-treated and mock treated cells.
(F) Quantification of ZIKV replication in 293T cells. Cells were treated with ddhC for 24 h and then infected with ZIKV at an MOI of 1 for 24 h, and viral titers were determined by plaque assay. PFU, plaque-forming unit.
(G) Immunofluorescence analysis of the ZIKV E proteins in 293T cells. Cells were treated with ddhC for 24 h and then infected with ZIKV at an MOI of 1 for 24 h, and stained by anti-E protein antibody and analyzed by confocal immunofluorescence microscopy. Scale bars, 10 μm. Cellular viral E protein levels were determined on the right. Cell numbers measured (n) are shown on the top.
(H) 293T cells were treated with ddhC for 24 h and then infected with NanoLuc reporter ZIKV at an MOI of 2. At indicated time post infection, the cells were lysed and measured for luciferase activities.
For (B), (C) and (E-G), data are shown as mean ± SD of three biological repeats (n = 3).
*p < 0.05, **p < 0.01, ***p < 0.001 by unpaired Student’s t test. ns, not significant.

