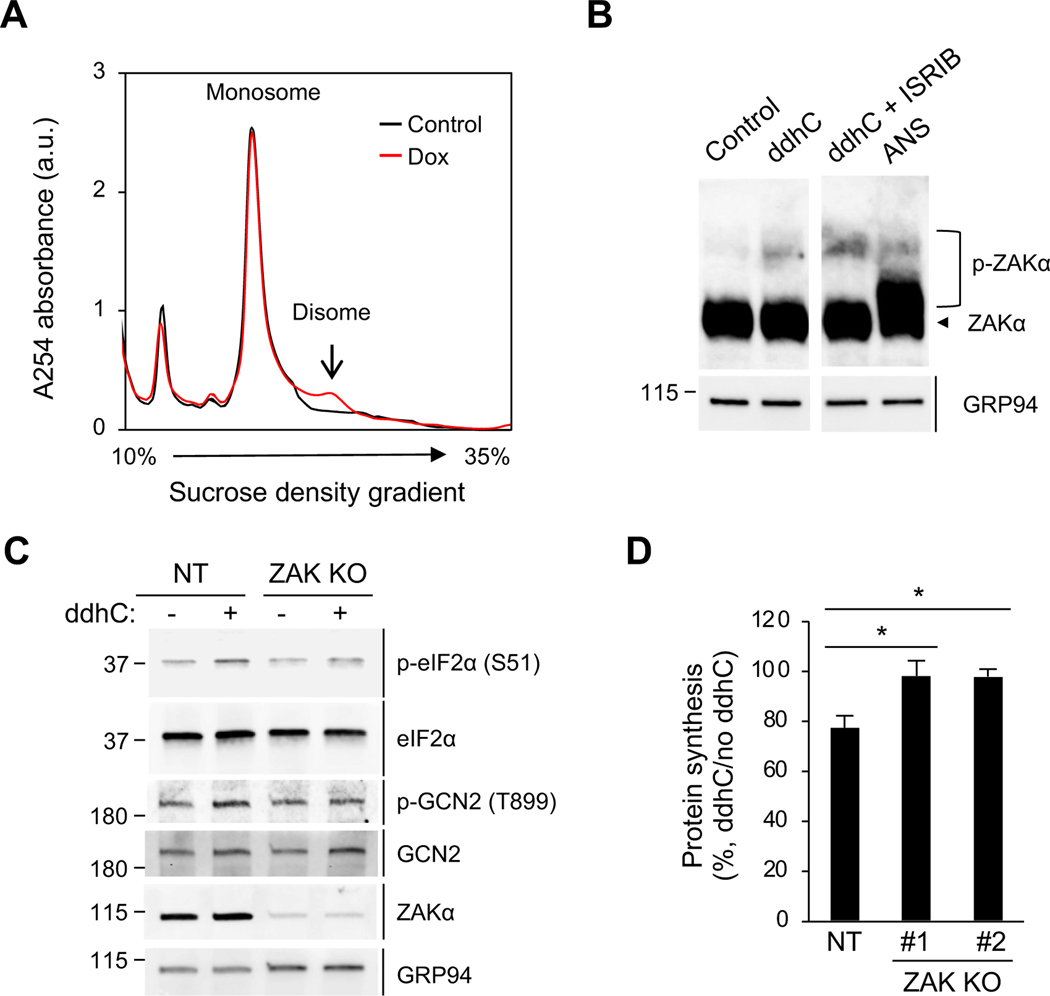
Figure 6. ZAK is required for viperin-induced translation inhibition.
(A) Polysome profile analysis of the formation of RNase-resistant disomes in 293T.iVip cells. Cell were treated with Dox for 24 h. Cell lysates were cleared by centrifugation, digested by RNase, loaded onto a 10–35% sucrose gradient, and subjected to ultracentrifugation. Absorbance was monitored at 254 nm to record the polysome profile. The monosome and disome pools are indicated. a.u., arbitrary unit.
(B) Immunoblot analysis of phosphorylation of ZAKα in 293T cells. Cells were treated with ddhC or co-treated with ISRIB for 24 h and analyzed by phos-tag gel electrophoresis and immunoblotting with anti-ZAK and anti-GRP94 antibodies. Anisomycin (ANS) serves as a positive control. An irrelevant lane was spliced out between lane 2 and 3.
(C) Immunoblot analysis of the phosphorylation of eIF2α and GCN2 in ZAK knockout 293T cells (ZAK KO) and control cells expressing non-targeting gRNA (NT). Cells were treated with ddhC for 24 h. Cell lysates were analyzed by immunoblotting with antiphospho-eIF2α (S51), anti-eIF2α, anti-phospho-GCN2 (T899), anti-GCN2, anti-ZAK and anti-GRP94 antibodies.
(D) NT and two ZAK KO cell lines (#1 and #2) were treated with ddhC for 24 h and stained by OP-Puro labeling followed by flow cytometry. Data are shown as mean ± SD of three biological repeats (n = 3). *p < 0.05 by unpaired Student’s t test. See also Figures S5 and S6.

