Figure 1.
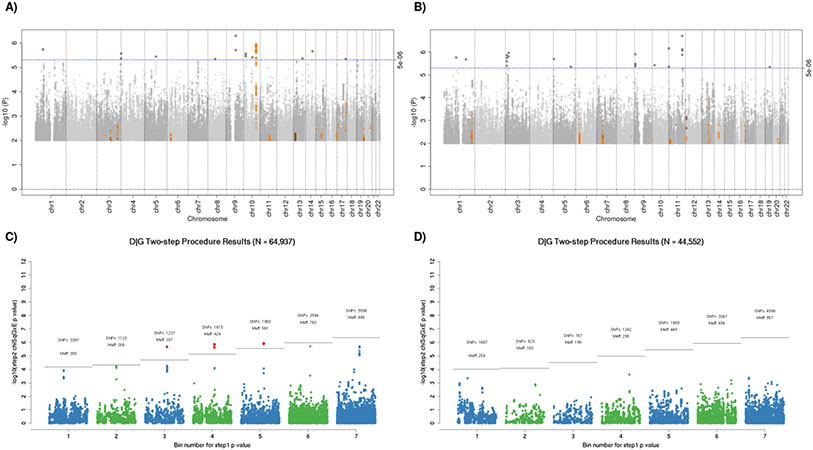
All analyses are adjusting for age, sex, study site, total energy consumption, and the first three principal components. A) & C) Manhattan plots of interaction between genome-wide genetic variants and non-drinking (A) or heavy drinking (C) as compared to light-to-moderate drinking. The blue horizontal line indicates the threshold for suggestive hits (p-value < 5e-6), and SNPs plotted in orange have previously reported associations with colorectal cancer. B) & D) Plots of expectation-based partitions adjusted by the number of effective tests in each bin. The gray line indicated the threshold for significance based on the bin specific alpha-threshold (Meff). (B) shows 13 significant SNPs, which are all located in the 10q24.2/COX15 region. Point colors alternate blue and green for visibility; red points denote statistically significant findings. Abbreviations: SNPs = number of markers included in each bin. Meff = the number of effective tests in each bin after accounting for correlation between SNPs.

