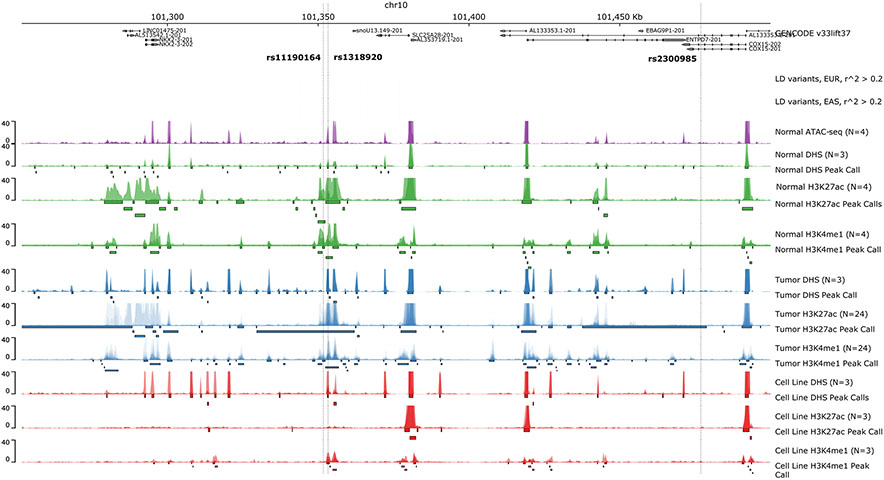
Figure 5.
Chromatin accessibility assays highlighting peaks within the 10q24.2/COX15 region. Top panel indicates GENCODE reference genes (GRCh37). Variants with r^2 > 0.2 within 500kb of tag SNP rs11190164 are color-coded by r^2 value. LD was calculated for the EUR and EAS populations within phase 3 of the 1000 Genomes (panel 2 and 3 from the top). Healthy ATAC-seq, DNASE-seq, H3K27ac histone ChIP-seq, H3K4me1 histone ChIP-seq p-value bigwigs are indicated in green. The same set of assays for tumor samples are indicated in blue. The same set of assays for cell lines SW480, HCT116, COLO205 are overlaid and indicated in red.

