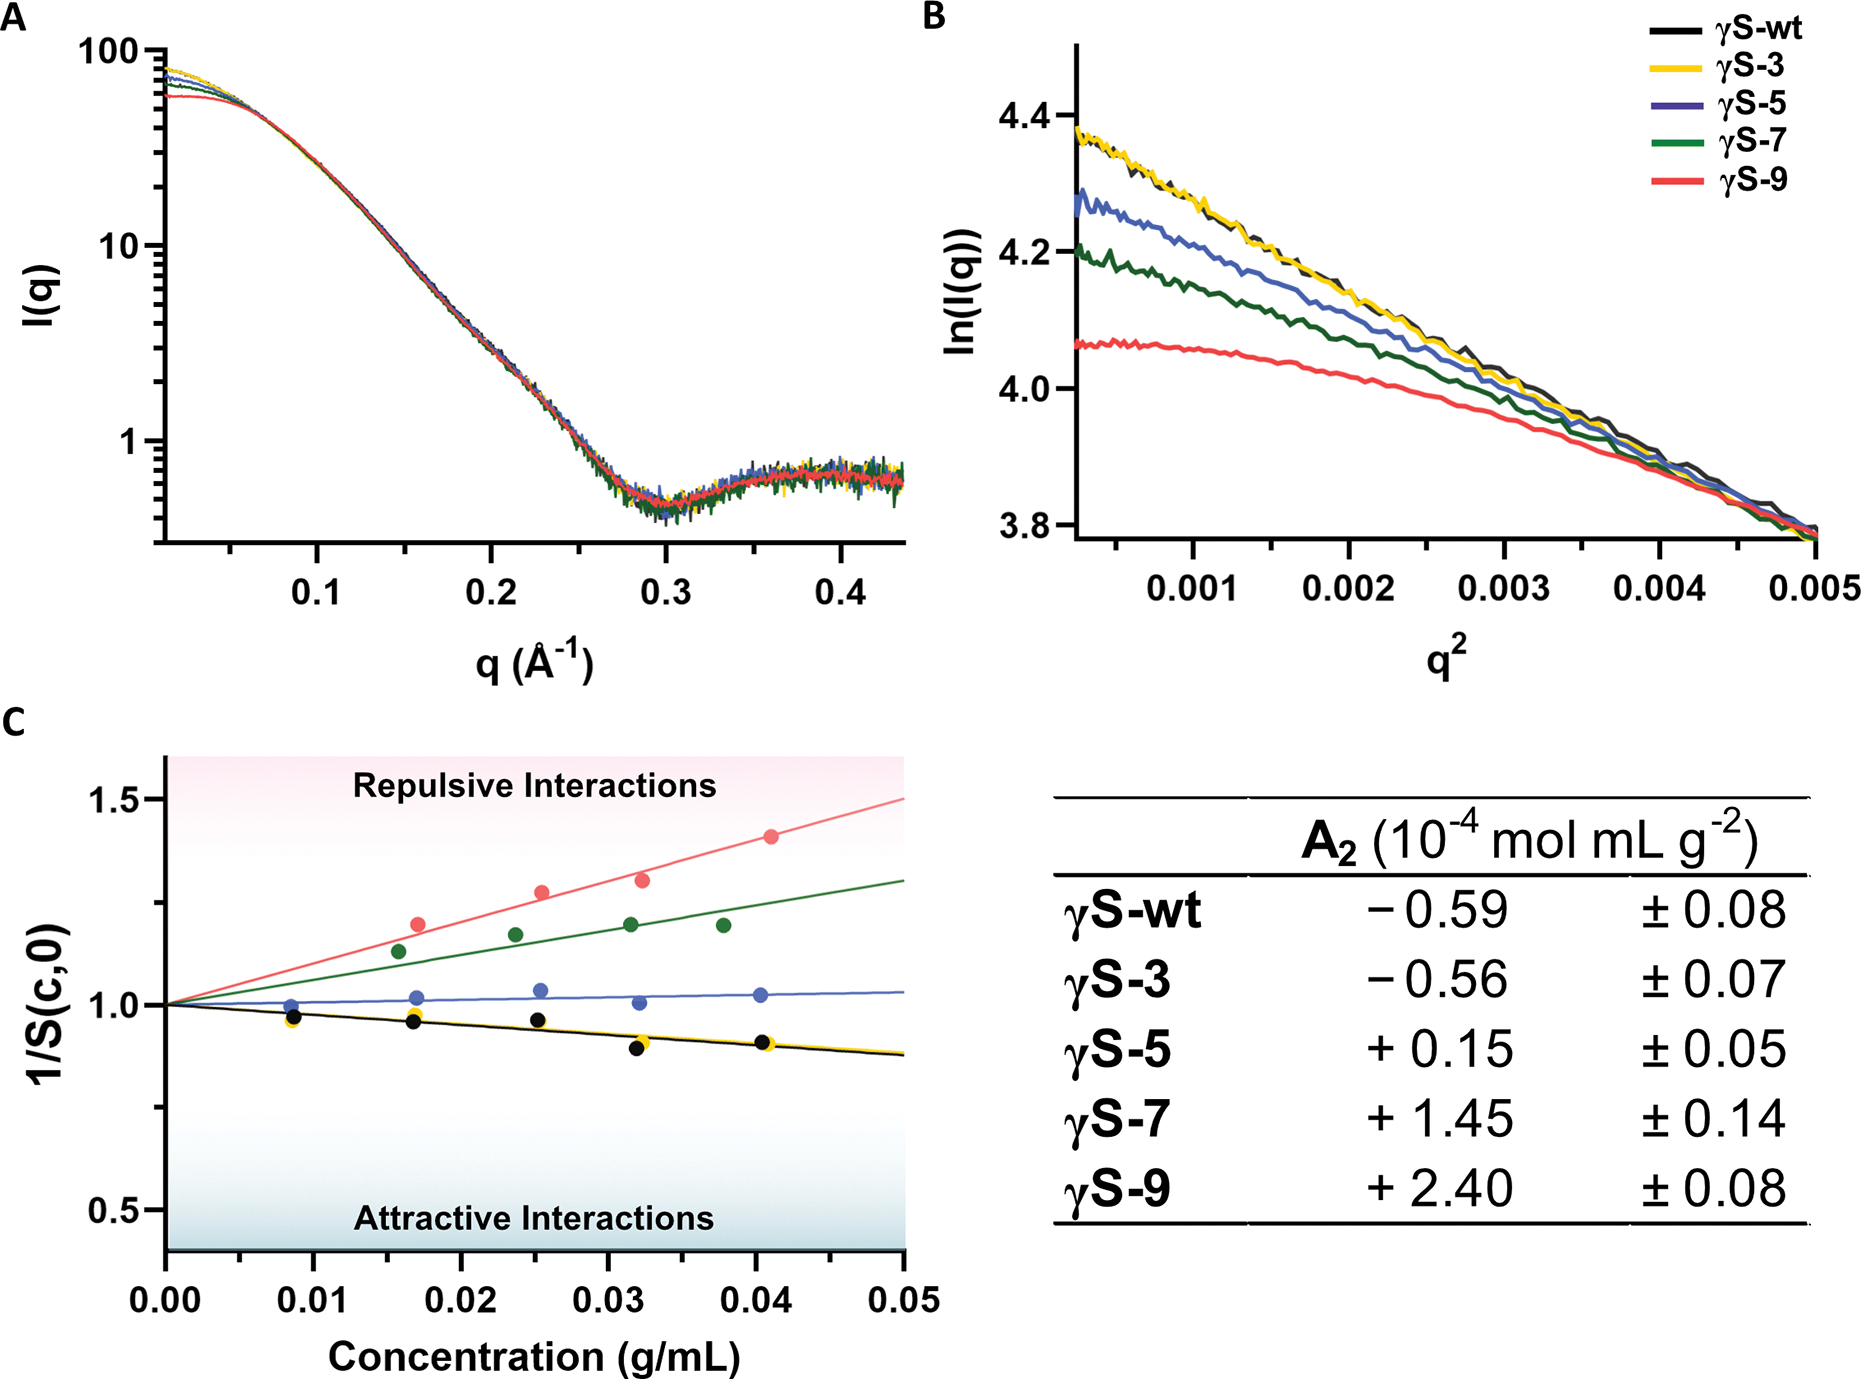
Figure 3, related to Figure S2. Small angle x-ray scattering (SAXS) analysis to determine A2.

(A) SAXS profiles for γS-wt (black), γS-3 (yellow), γS-5 (blue), γS-7 (green), and γS-9 (pink) at approximately 40 mg/mL. (B) Guinier plot of the scattering profiles of each variant at approximately 40 mg/mL. For both (A) and (B), the profile for γS-7 was scaled to normalize for concentration. (C) Left: The reciprocal of the structure factor at q = 0 as a function of concentration. Right: Second virial coefficient (A2) values calculated from the slope of the linear regressions.
