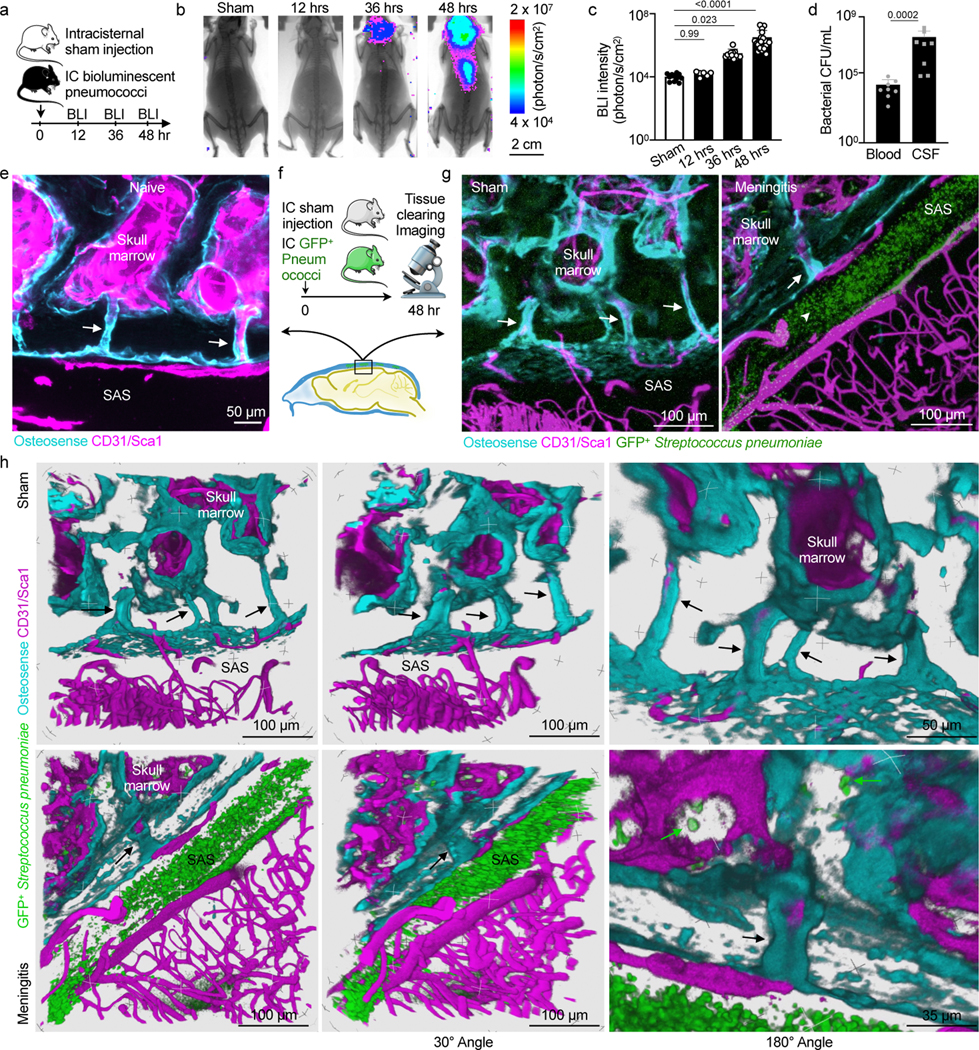
Fig. 3. Bacterial presence in meninges and the skull marrow.

a, Timeline for bioluminescent Streptococcus pneumoniae Xen10 meningitis. b, Bioluminescence imaging (BLI) of sham controls or mice after intracisternal injection of S. pneumoniae Xen10 (scale: 2 cm). c, Bacterial load measured by BLI (mean ± SD; n=11 sham, 6 12hr, 12 36 hr, 24 48 hr; P values represent a Kruskal-Wallis test with Dunn’s multiple comparisons test). d, Bacterial colony forming unit (CFU) assay from blood and CSF at 48 hours (mean ± SD; n=8; P value represents a Mann-Whitney two-sided rank test). e, Skull channels following tissue-clearing (171 μm, 3 μm/step with 57 steps) (scale: 50 μm, n=4 mice from 2 experiments). f, Tissue-clearing scheme. g, Representative z-stack images of sham controls (248 μm, 0.75 um/step with 331 steps) and mice after IC GFP+ Streptococcus pneumoniae JWV500 (267 μm, 3 μm/step with 89 steps) . CD31/Sca1 labels vasculature and osteosense marks bone (n=4 sham, 6 meningitis; scale: 100 μm). h, Three-dimensional reconstructions highlighting skull channels (arrows) and marrow bacteria (green arrows). Scale: 100 μm, 50 μm and 35 μm; data pooled from 3 independent experiments. Upper row indicates control mouse without bacterial injection, lower row indicates a mouse 48 hours after induction of meningitis.
