
FIGURE 2.
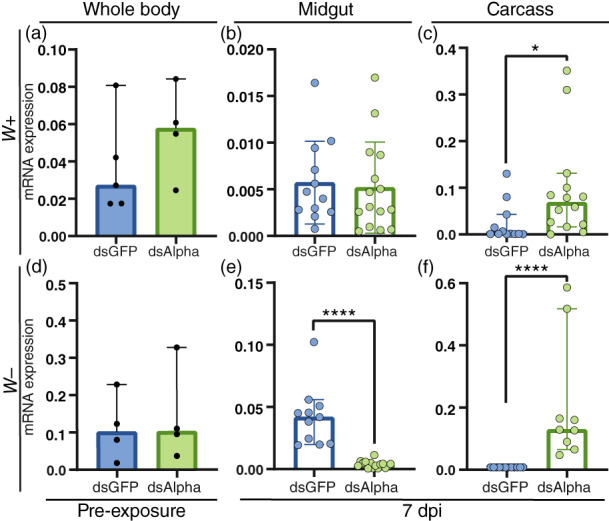
Expression of alpha‐Mann‐2a following RNA interference (RNAi). The expression of alpha‐Mann‐2a in control mosquitoes (dsGFP) and during alpha‐Mann‐2a RNAi (dsAlpha). (a–c) wAlbB mosquitoes (W+). (d–f) Wolbachia‐free mosquitoes (W−). (a, d) The levels of alpha‐Mann‐2a mRNA in whole‐body mosquitoes prior to dengue virus exposure through blood feeding (pre‐exposure) at 3 days post‐RNAi. Black circles represent individual whole‐body samples. N = 4–5. (b, c, e, f) Expression of alpha‐Mann‐2a at 7 dpi in the midgut and carcass. Blue and green circles represent individual tissues. Graphs display the relative expression to RpS6, bars represent the median and whiskers depict the 95% confidence intervals. Mann–Whitney: *p < 0.05, ****p < 0.0001. N = 9–15