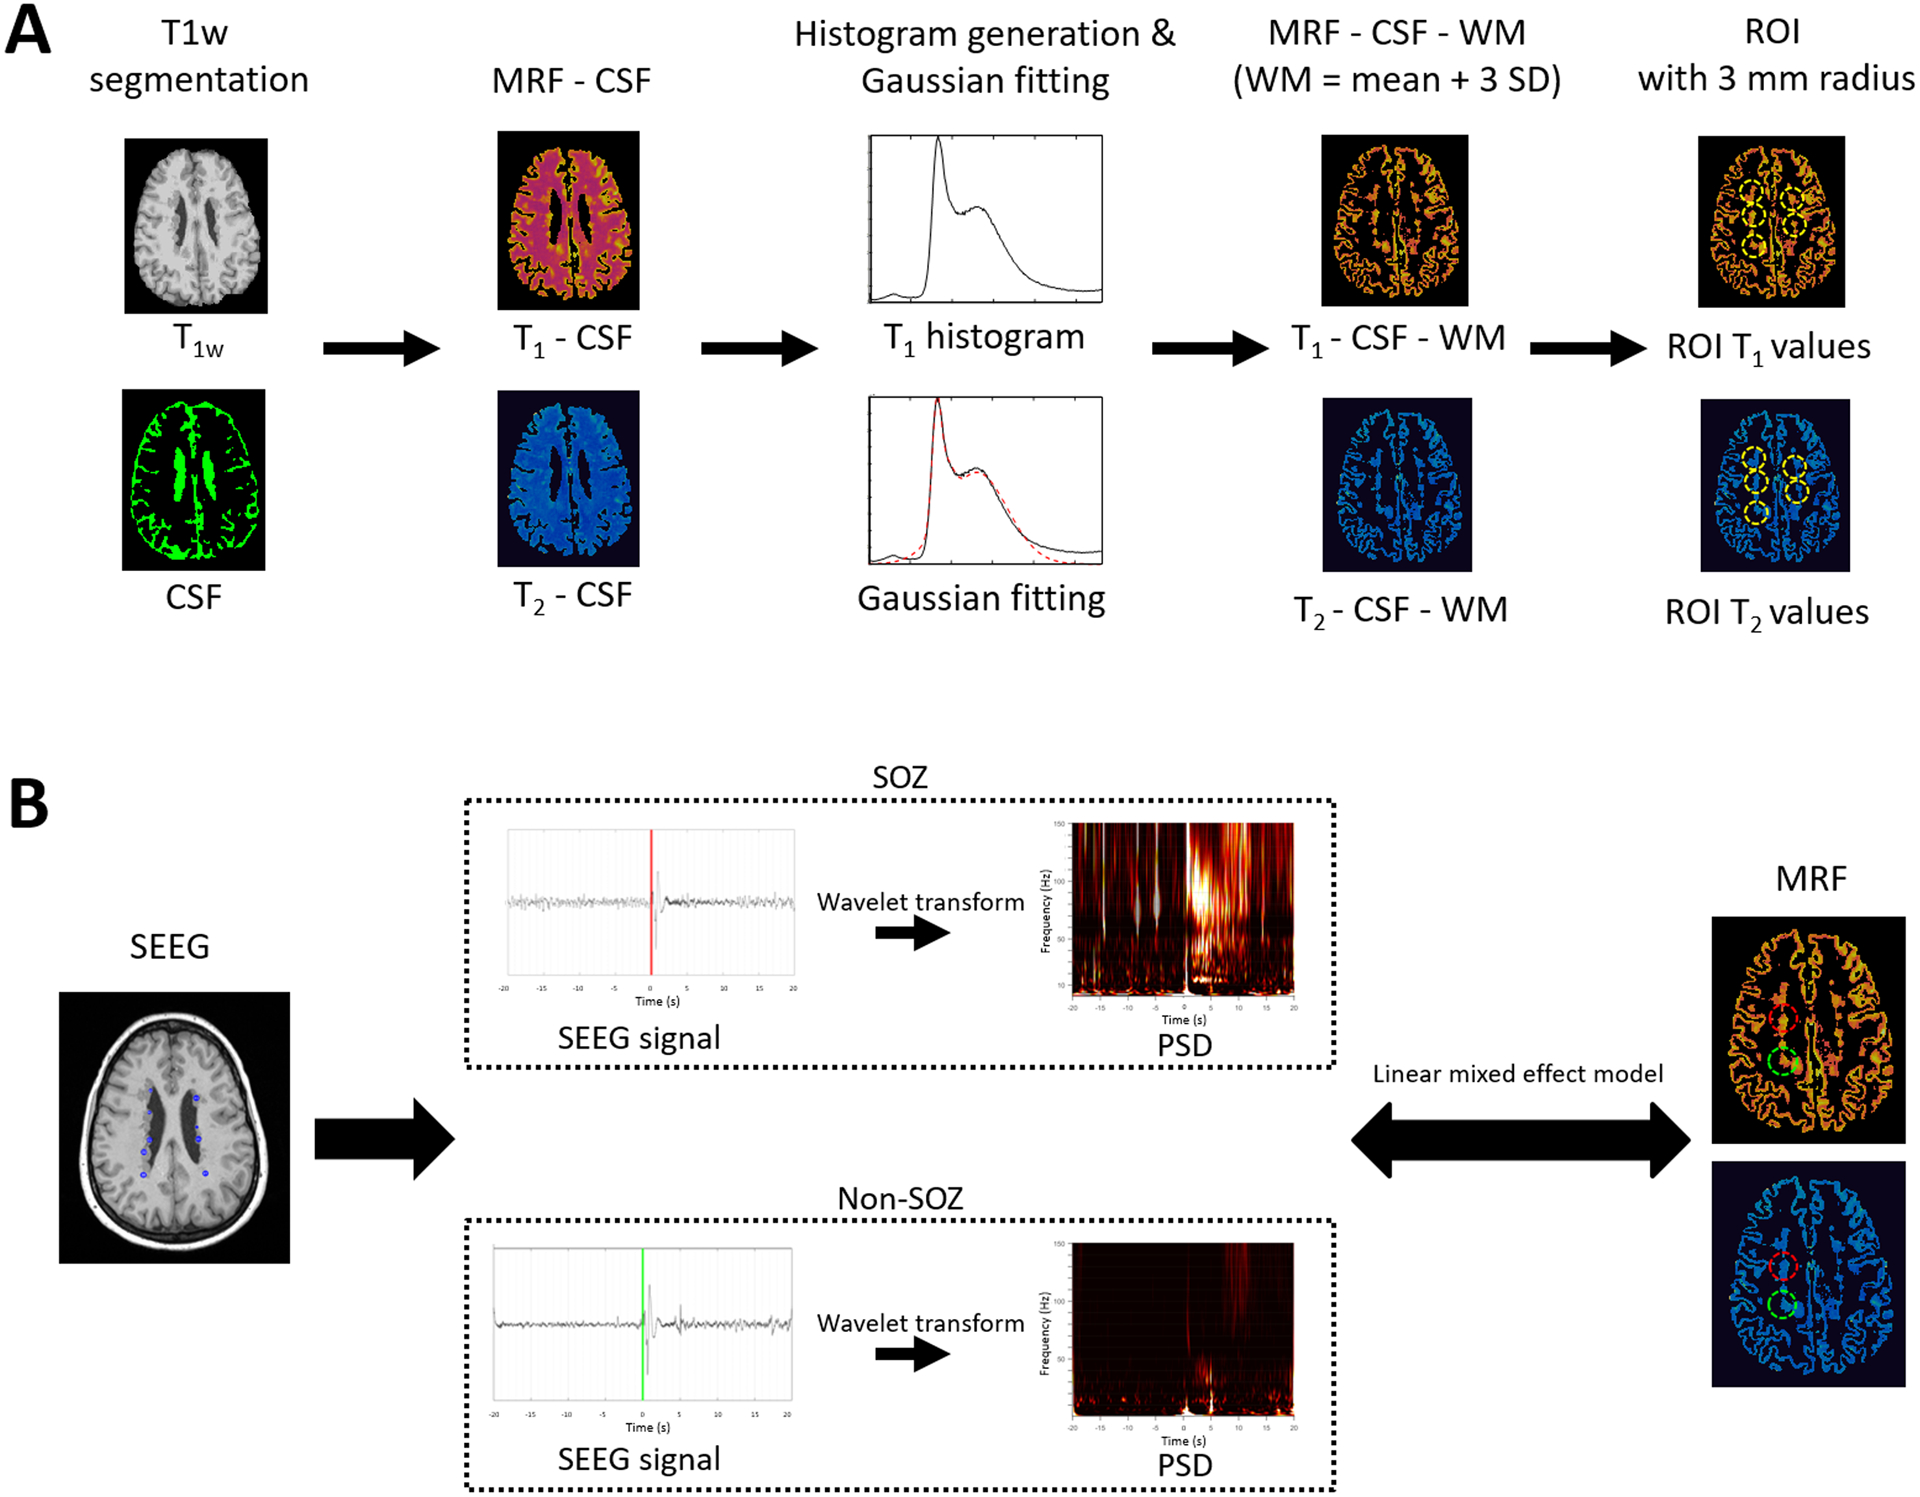
Figure 2. Diagram of study workflow.

(A) Extraction of T1 and T2 values from PVNH lesions. (B) Assessment of the correlations between T1 and T2 values and PSD of ictal-onset SEEG signals. Illustrated are the SEEG signals from SOZ nodule (red) and non-SOZ nodule (green). SEEG signals from both SOZ and non-SOZ nodules show high amplitude spike activity at the marked seizure onset. Compared to the non-SOZ nodule, the SEEG seizure pattern with the SOZ nodule consists of pre-ictal spiking followed by low-voltage fast activity at seizure onset. CSF: Cerebrospinal fluid. G-fitting: Gaussian fitting. WM: white matter. std: standard deviation. PVNH: periventricular nodular heterotopia. PSD: power spectral density. SEEG: stereotactic-electroencephalography. ROI: region of interest. SOZ: seizure onset zone. The mean and standard deviation of WM are calculated by the Gaussian fitting of the histogram. PSD is calculated by applying wavelet transform of SEEG signals at the seizure onset zone window. Red color denotes SOZ and green color denotes non-SOZ nodules for illustrative purpose. Markings on SEEG signal indicates the ictal onset obtained from clinical charts.
