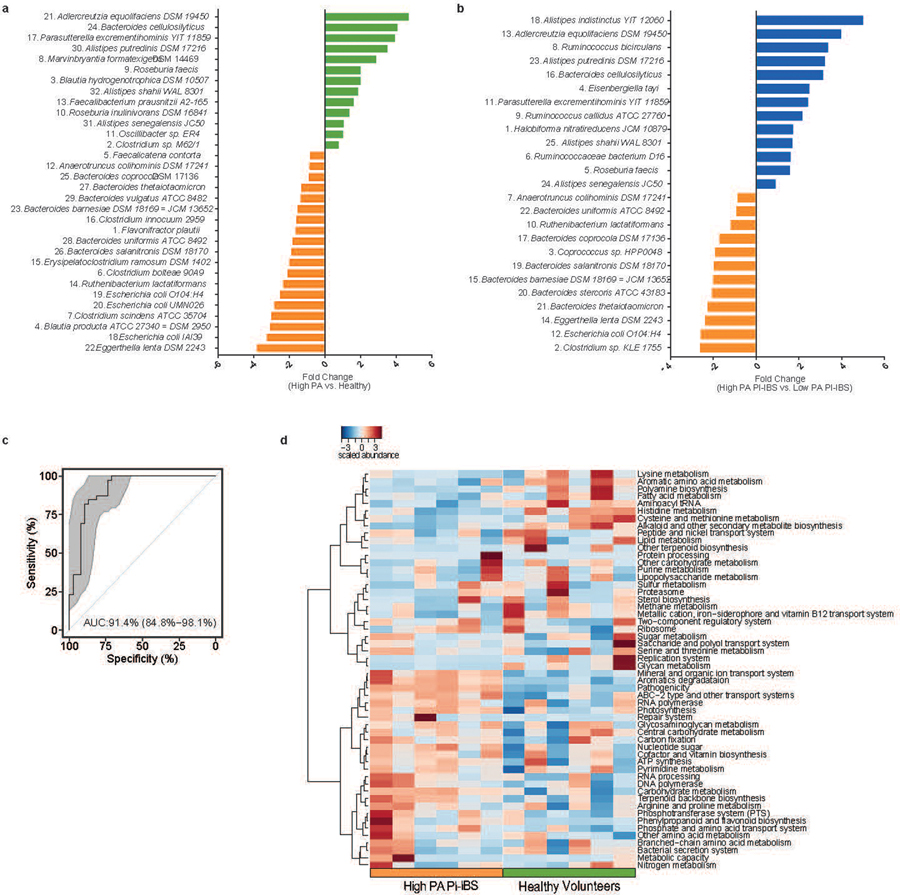
Extended Data Fig. 5. Differentially abundant taxa and KEGG pathways between healthy, low PA and high PA PI-IBS humanized mice.
a, Comparison between healthy and high PA PI-IBS humanized mice engrafted microbiota. 32 differentially abundant taxa were identified between high PA with healthy humanized mice. Of the identified taxa, 13 were in greater fold abundance in healthy humanized mice compared to high PA PI-IBS mice. Colors denote greater abundance in the respective humanized group (green: healthy, orange: high PA PI-IBS, n=6 feces/phenotype). Numbers labeling the taxa correspond to the labels presented in the main manuscript, Fig. 4f. b, Differences in observed taxa between engrafted microbiota of low PA and high PA PI-IBS humanized mice. Microbiome analysis showed 25 differential taxa between low PA and high PA PI-IBS humanized groups, with 13 in greater abundance in low PA, and 12 in high PA. Colors denote greater abundance in the respective humanized group (blue: low PA PI-IBS, orange: high PA PI-IBS n=6 feces/phenotype). Numbers adjacent to taxa correspond to labels provided in main manuscript Figure 4g. c, Receiver operating curve assessing random forest ability to predict PA status based on taxa in humanized mice. The ability of random forest modelling algorithm to predict PA status based on selected taxa was assessed in humanized mice with an area under curve (AUC) of 0.914, (95% CI 0.848–0.981). Grey area shows confidence shape. d, Heatmap of predicted KEGG pathway differences between high PA and healthy humanized mice (n=6 feces/phenotype).

