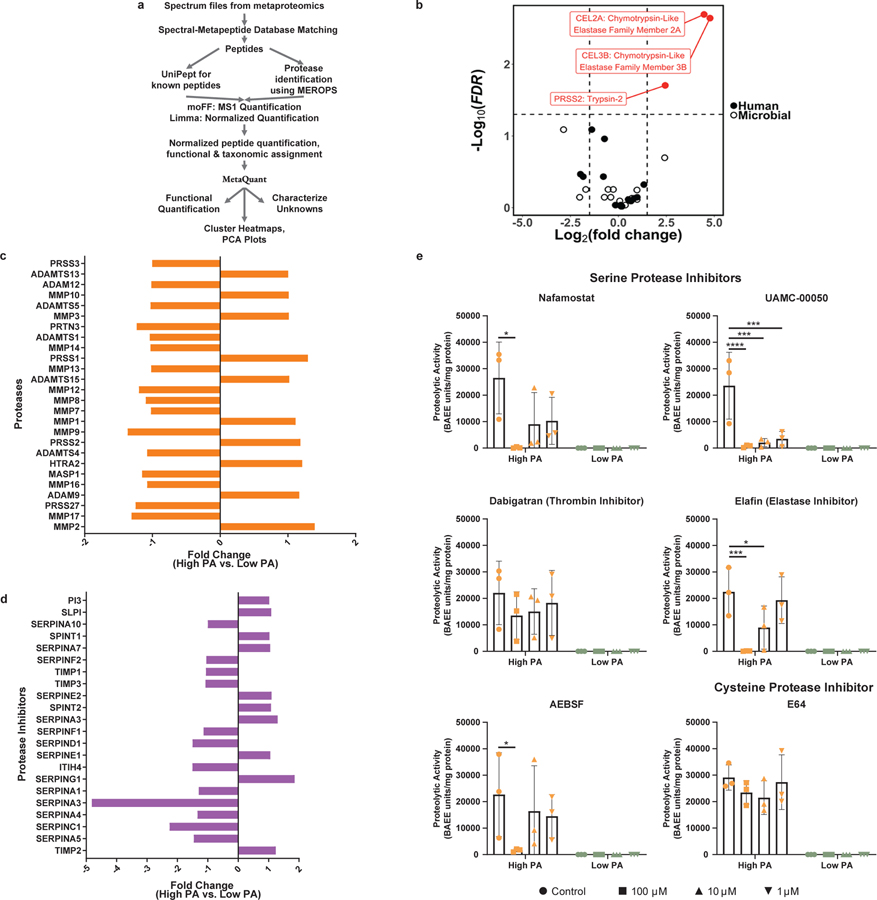
Figure 2: Fecal and tissue proteomics demonstrates serine proteases of human pancreatic origin drive high PA in PI-IBS.
a, Pipeline used for identifying human and microbial fecal proteomic profiles of high PA and low PA feces. b, Metaproteomic analysis of high and low PA fecal samples. Volcano plot highlights feces from high PA volunteers have an increased abundance of host pancreatic proteases (n=7 high PA, 6 low PA, FDR<0.05). Three proteases, chymotrypsin like pancreatic elastase 2A, 3B (FDR=0.002 for each, Standard t-test) and trypsin 2 (FDR=0.02, Standard t-test), all serine family, were identified in greater abundance in high PA samples. c-d, Proteomic analysis of rectosigmoid colonic biopsies using SOMAscan® platform. Comparisons of proteases (c) and protease inhibitors (d). Analysis reveals that production of mucosal derived proteases and inhibitors are comparable regardless of PA phenotype (n=7 high PA, 6 low PA). e, In vitro inhibition of high PA FSN with protease inhibitors. AEBSF (100μM *p=0.042), nafamostat (100μM *p=0.002), UAMC-0050 (100μM ****p=0.0001, 10μM ***p=0.0002, 1μM ***p=0.0004), and elafin (100μM ***p=0.0005, 10μM *p=0.032) significantly inhibited PA in vitro while dabigatran (thrombin inhibitor) and E64 (cysteine protease inhibitor) had no effect. (2-way ANOVA, Tukey’s multiple comparison test, n= 3 high and 3 low PA FSNs per condition). Barplots are presented as mean ± s.d.

