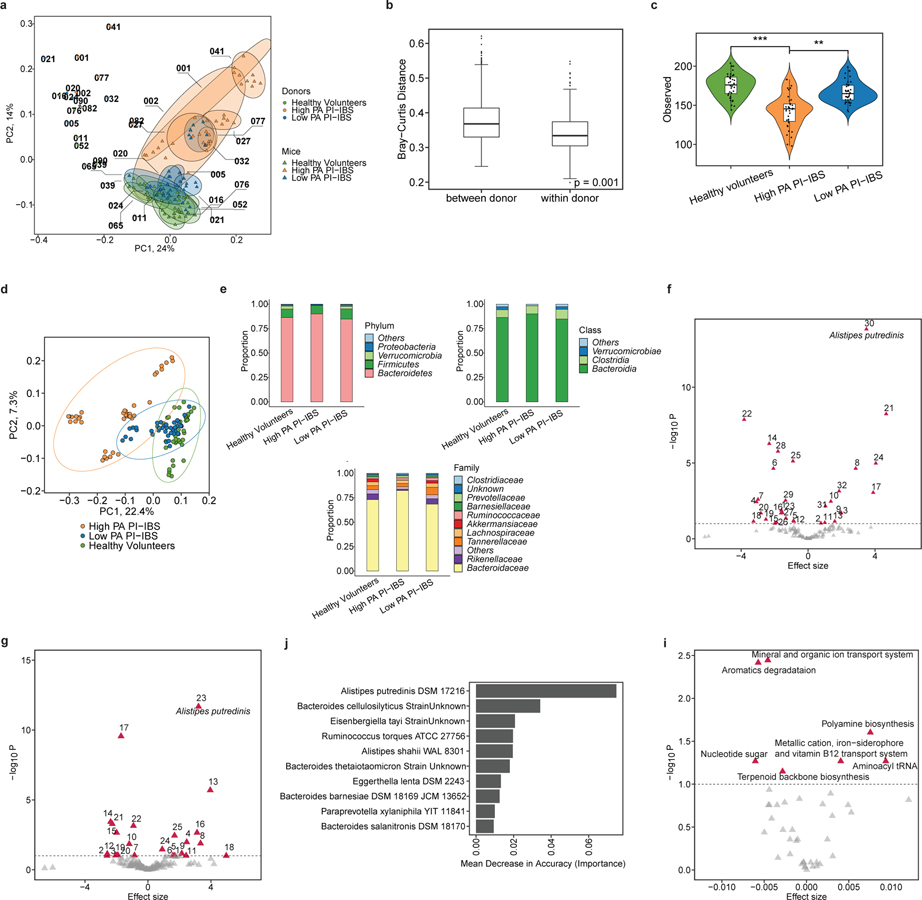
Figure 4: Microbial diversity and composition in humanized mice identify specific microbial taxa predicative of PA status and metabolic pathway differences.
a, Mice humanized with high PA, low PA PI-IBS and healthy volunteer microbiota have differences in microbiota composition (n=6 human feces/phenotype, dots represent average). b, Humanized mice intra-group, not inter-group relatedness. Humanized mice microbiota are compositionally and taxonomically different when compared to each other, but similar within its group (Bray-Curtis, PERMANOVA with 999 permutations, p=0.001). c, Alpha diversity across humanized mice. Healthy volunteer and low PA humanized mice have greater species richness compared to high PA humanized mice (n=6 human feces/phenotype, dots represent average, linear regression on observed species **p=0.01,***p=0.002). d, Beta diversity measures in humanized mice. Microbial composition differs between each humanization state (Bray-Curtis, PERMANOVA with 999 permutations, p=0.01). e, Higher level taxonomic evaluation of engrafted microbiota in humanized mice (n=6 human feces/phenotype, dots represent average). f-g, Volcano plot(s) highlighting strain level differences between high PA and healthy volunteer (f) or high and low PA PI-IBS humanized mice (g). Red icons indicating differences in abundance (q<0.1) with A. putredinis identified (n=6 human feces/phenotype, dots represent average). h, Prediction model of microbiota for PA status by random forests. The top 10 taxa predictive of PA status in mice assessed using mean decrease in accuracy. i, Predicted KEGG pathway differences between high PA and healthy volunteer humanized mice. Differentially abundant KEGG pathways with q<0.1. Effect size denotes average difference in KEGG functional unit between reference and comparison groups. Boxplots as previously described.

