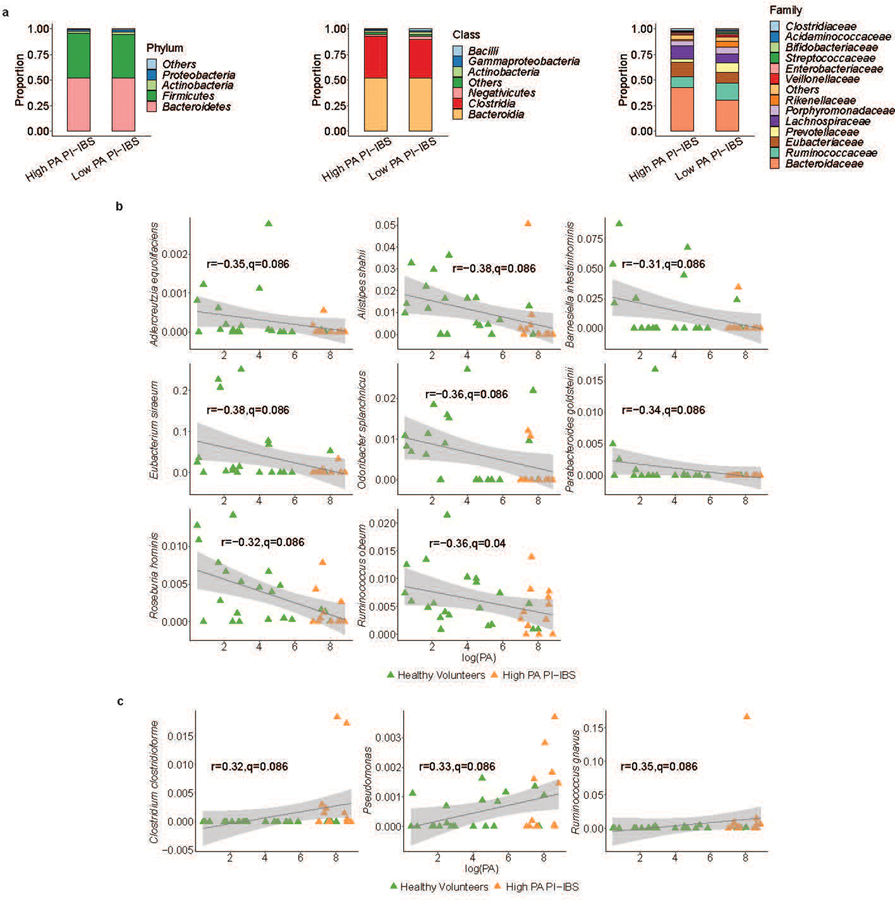
Extended Data Fig. 1. Taxa differentially abundant between low and high PA status and correlation with fecal PA.
a, The microbiota of high and low PA PI-IBS patients (n=12 high PA PI-IBS, 17 low PA PI-IBS) were compared at the phyla, class, and family levels. At both phyla and class levels of taxonomy, no significant differences were observed between the two groups of patients. However, one taxon, Rikenellaceae, was differential at the family level (FDR<0.05). Rikenellaceae, the family of A. putredinis and was in higher abundance in low PA PI-IBS subjects with an average abundance of 5.3%, compared to 1.1% in high PA PI-IBS individuals. b, Correlation scatterplots for differentially abundant taxa negatively correlating with PA. In addition to the top 3, an additional 8 differentially abundant (11/14) taxa correlated with low fecal PA. They exhibited weak negative correlation (0.31 ≤ |r| ≤ 0.38). High PA (orange) and healthy volunteers (green) are plotted. Correlation coefficients (r) and q-values are generated from comparisons within the entire cohort to assess the relationship between PA and taxa abundance (n=21 HV, 12 high PA PI-IBS, 17 low PA PI-IBS). Grey area shows 95% confidence level for linear smooths. c, Correlation scatterplots for differentially abundant taxa that positively correlate with PA. Of the 14 differential taxa, only 3 positively correlated with high fecal PA. Clostridium clostridioforme, Pseudomonas and Ruminococcus gnavus all had a weak, positive correlation (0.32 ≤ |r| ≤ 0.35). Plots were generated as stated above. Grey area shows 95% confidence level for linear smooths.

