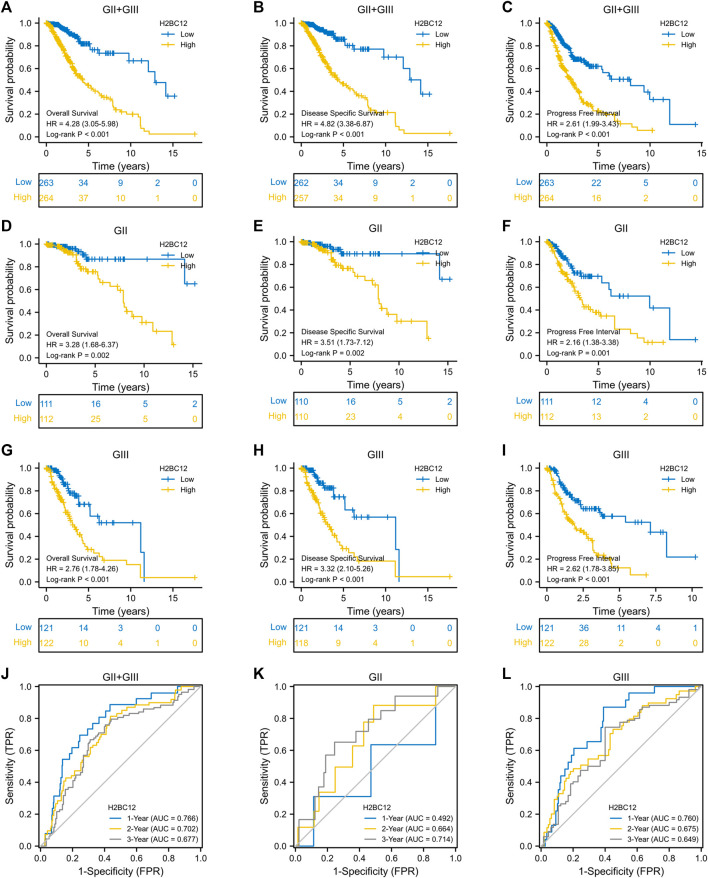
FIGURE 3.
High expression of H2BC12 is associated with poor OS, DSS, and PFI in patients with GII and/or GIII. OS (A), p < 0.001, DSS (B), p < 0.001, and PFI (C), p < 0.001 were significantly poorer in GII + GIII patients with high H2BC12 expression than those with low H2BC12 expression. Furthermore, OS, DSS, and PFI of GII (D–F) and GIII (G–I) were analyzed respectively. OS, Overall Survival; DSS, Disease-Specific Survival; PFI, Progress-Free Interval. (J) tROC curve demonstrated AUC values for 1-, 2-, and 3-years survival in GII + GIII as 0.766, 0.702, and 0.677, respectively. The 1-, 2-, and 3-years AOC values in GII were 0.492, 0.664, and 0.714 (K). The 1-, 2-, and 3-years AOC values in GIII were 0.760, 0.675, and 0.6499 (L).

