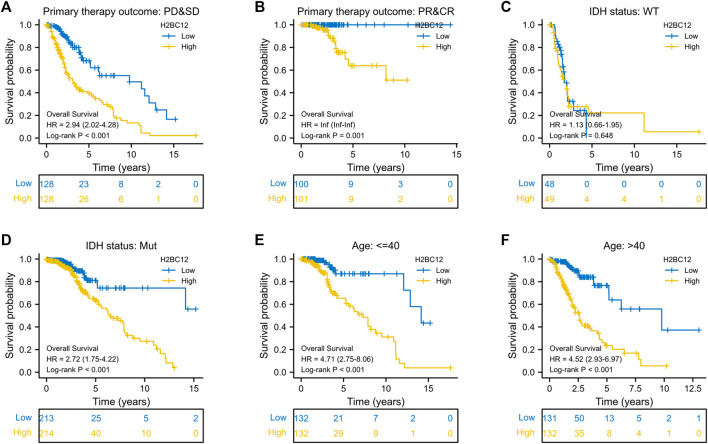
FIGURE 4.
Clinical stratification analysis of the survival difference in the high- and low-H2BC12 groups by primary therapy outcome, IDH status, and age. Kaplan-Meier survival curves of patients in the high- and low-H2BC12 groups within eight clinically stratified subgroups, including primary therapy outcome: PD&SD (A), primary therapy outcome: PR&CR (B), IDH status: WT (C), IDH status: Mut (D), age<=40 (E) and age>40 (F), respectively. Patients in the low-H2BC12 group had better survival outcomes than those in the high-H2BC12 group across all clinically stratified subgroups except the IDH status of WT (p < 0.01).

