. 2018 Jun 21;8(40):22569–22576. doi: 10.1039/c8ra04031a

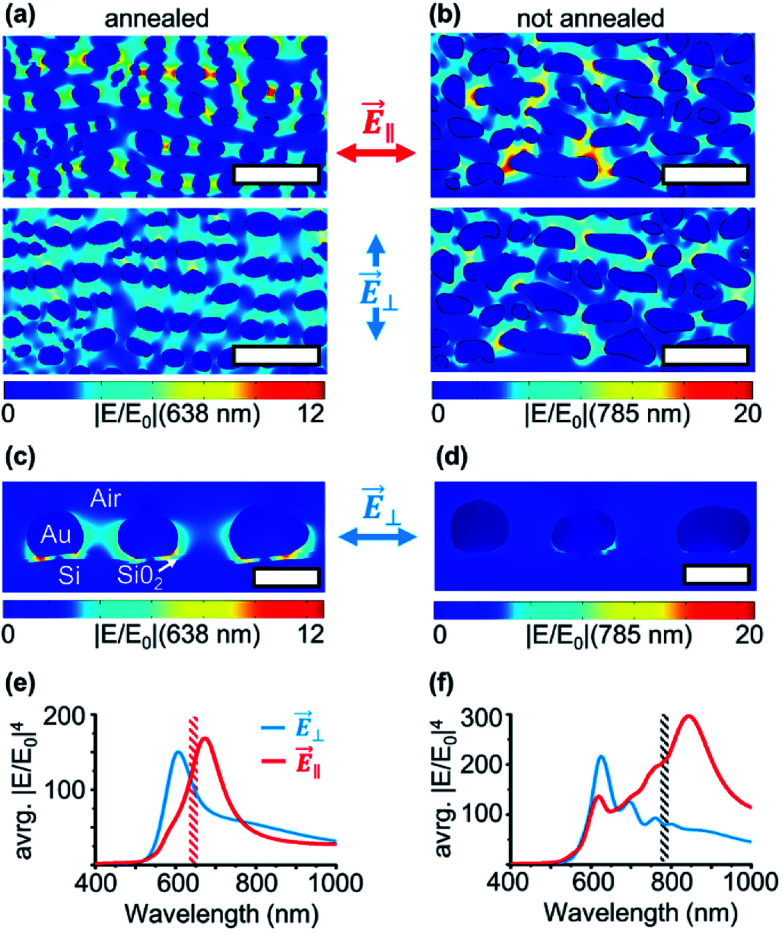
Fig. 4. FEM calculation results of the near-field enhancement of electric |E/E0| based on SEM images. The systems modeled correspond to (a) annealed and (b) non-annealed gold samples for two different directions of the incident electric field (top) E⃑ and (bottom) E⃑. Scale bars: 100 nm. The particle cross-section visualization of the annealed (c) and not annealed (d) sample is shown below (scale 30 nm). Simulated spectra of average SERS enhancement (∝ avrg. |E/E0|4) for annealed (e) and not annealed (f) particle geometries for E⃑ and E⃑ polarizations. Simulated spectra of average SERS enhancement (∝ avrg. |E/E0|4) for annealed and not annealed particle geometries for E⃑ and E⃑ polarizations.

Fig. 4