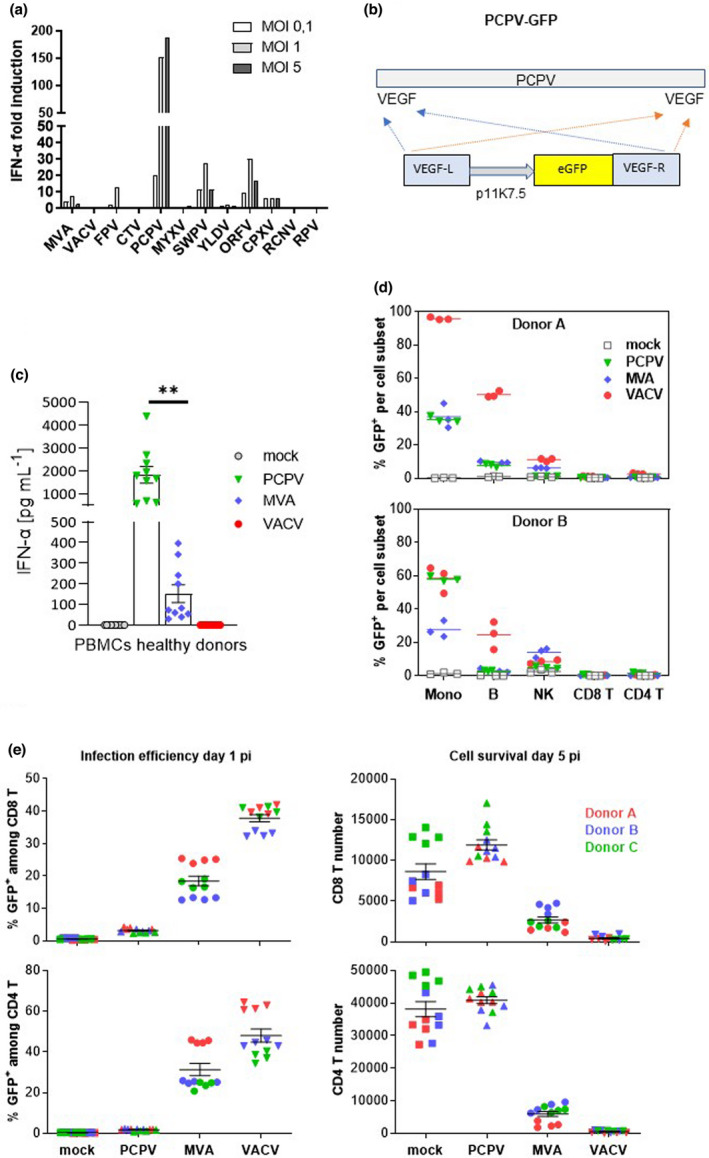
Figure 1.

Selection and characterisation of PCPV. (a) Screening of poxviruses for IFN‐α induction in human PBMCs: immune cells were infected at MOI 0.1, 1 and 5 with each of the indicated viruses, and IFN‐α secretion was measured in the cell culture supernatant the next day. Shown is the mean fold induction of IFN‐α secretion compared with mock‐infected cells from two experiments with two donors each. (b) Schematic representation of the PCPV genome with VEGF genes located at both extremities. An eGFP expression cassette controlled by the poxvirus‐specific promoter p11K7.5 was inserted via homologous recombination in both VEGF loci. (c) PBMCs from 10 healthy donors were infected at the MOI 0.3 with PCPV, MVA and VACV viruses encoding GFP. The next day, the supernatant was harvested, and IFN‐α was quantified. Scatter plots present data from a single experiment with ten different blood donors as mean ± SEM. (d) Infection profile: PBMCs were incubated with either PCPV‐GFP, MVA‐GFP or VACV‐GFP at a MOI of 1, or left untreated (mock). The percentage of GFP‐expressing cells within live monocytes (mono), B lymphocytes (B), T lymphocytes (CD4+ T, CD8+ T) and natural killer (NK) cells was determined by flow cytometry at 1 day post‐infection. Mean of triplicate samples is indicated. Data are from two independent experiments with one PBMC donor each. (e) Activated T cells resist PCPV, but not MVA or VACV infection: PBMCs were pretreated with polymer‐bound anti‐CD3 plus anti‐CD28 and IL‐2 for 2 days and then incubated with PCPV‐GFP, MVA‐GFP or VACV‐GFP at MOI 1 in quadruplicate. The percentage of GFP+ cells (infection efficiency) and the total cell count (cell survival) were determined by flow cytometry for both activated CD8 and CD4 T‐cell subsets, at 1 or 5 days post‐infection, respectively. Scatter plots present data from a single experiment with three different blood donors as mean ± SEM.
