Figure 2.

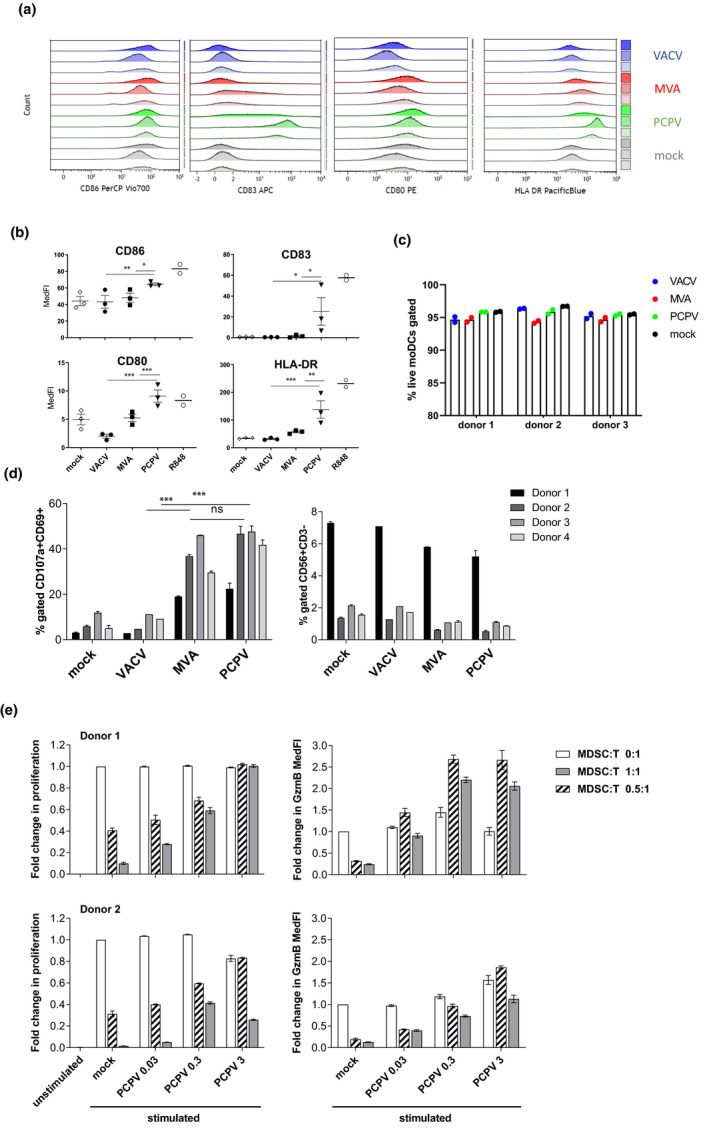
Immunomodulatory effects of PCPV in human immune cells. Infection and activation of APCs: moDCs from three healthy donors were infected at MOI 0.3 with PCPV, MVA or VACV, or treated with the TLR7/8 ligand R848 at 10−4 M. The markers CD86, HLA‐DR, CD83 and CD80 were followed by flow cytometry 16 h after infection. Gating strategy: FSC/SSC, singlets, live/ respective marker (medFI) in live cell population. (a) Median fluorescence intensities presented as staggered overlays. (b) Means of median fluorescence intensities in live cells (MedFI) ± SEM are represented. A repeated mixed model was built, if group effect was found statistically significant, and post hoc comparisons were made with the Tukey multiplicity adjustment: PCPV was able to upregulate all the four markers significantly better than MVA and VACV (CD80: P‐values < 0.001); CD83: compared to MVA, P‐value = 0.017 and VACV, P‐value = 0.015; CD86: compared to MVA, P‐value = 0.012 and VACV, P‐value = 0.003; and HLA‐DR: compared to MVA, P‐value = 0.004 and VACV, P‐value < 0.001. (c) Shown is the percentage of live moDCs at harvest time point after infection with respective virus at MOI 0.3. (d) Activation and degranulation of NK cells: PBMCs from four donors were infected at MOI 0.3 with either PCPV, MVA or VACV. After overnight incubation, K562 cells were added as targets at a ratio of 1:1. After 90 min of co‐culture, the percentage of activated, degranulating NKs was determined as CD69+CD107a+ cells within the population of NK cells (CD3−CD56+). Mean ± SD for each donor is shown. A repeated mixed model was built, if group effect was found statistically significant; post hoc comparisons were made with the Tukey multiplicity adjustment: PCPV and MVA increased the fraction of activated NK significantly better than VACV (P‐value < 0.001), but no significant differences were found between them (P‐value = 0.382). (e) MDSCs lose their suppressive function upon treatment with PCPV: the suppressive activity was tested in a proliferation assay using autologous CD8+ T as responder cells. CFSE‐labelled T cells were cultured with or without MDSCs (MDSC:T ratios were 0.5 :1, 1:1 or 0:1, respectively) for 4 days in the presence or absence of PCPV, and polymer‐bound anti‐CD3/anti‐CD28 plus IL‐2, or left unstimulated. The percentage of proliferating granzyme B+ CD8+ T cells, and the median fluorescence intensity of granzyme B in proliferating CD8+ T cells were determined. Shown is the fold change in proliferation and granzyme B expression compared with stimulated T cells cultured alone. Bars represent mean ± SEM of quadruplicate or triplicate samples for donor 1 and quadruplicate samples for donor 2. Data are from two independent experiments with one blood donor each.
