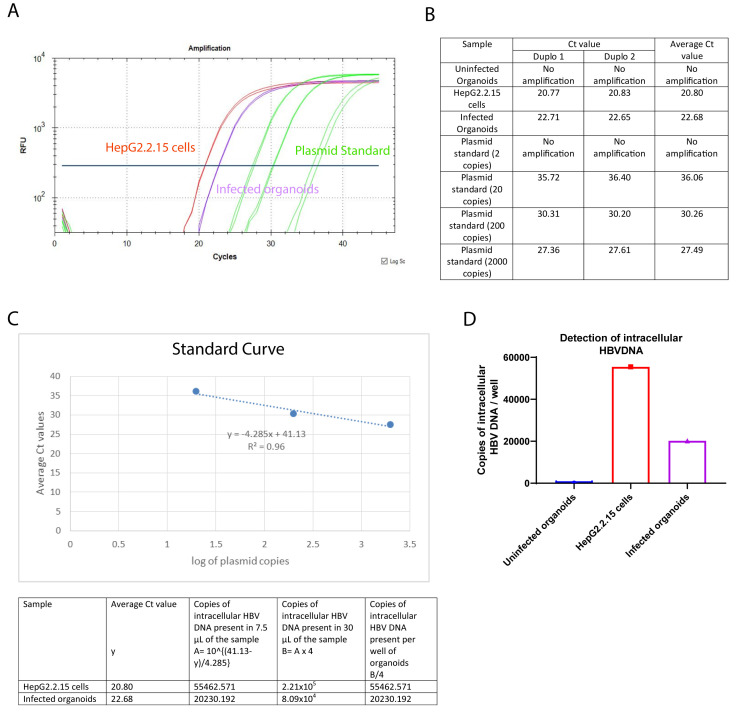
Figure 5. Expected results for the detection of intracellular HBV DNA from the culture supernatants.
A) PCR Curve of the different sample conditions. B) Observed Ct values and average Ct values for the different sample conditions, C) Generation of the standard curve using the Ct values of different dilutions of the standard plasmids, and calculation of the copies of intracellular HBV DNA present in the infected organoids and the HepG2.2.15 cells. D) Bar graph of the intracellular HBV DNA copy numbers present in the different samples. The y-axis represents the intracellular HBV DNA copy numbers, and the x-axis represents the different sample conditions.

