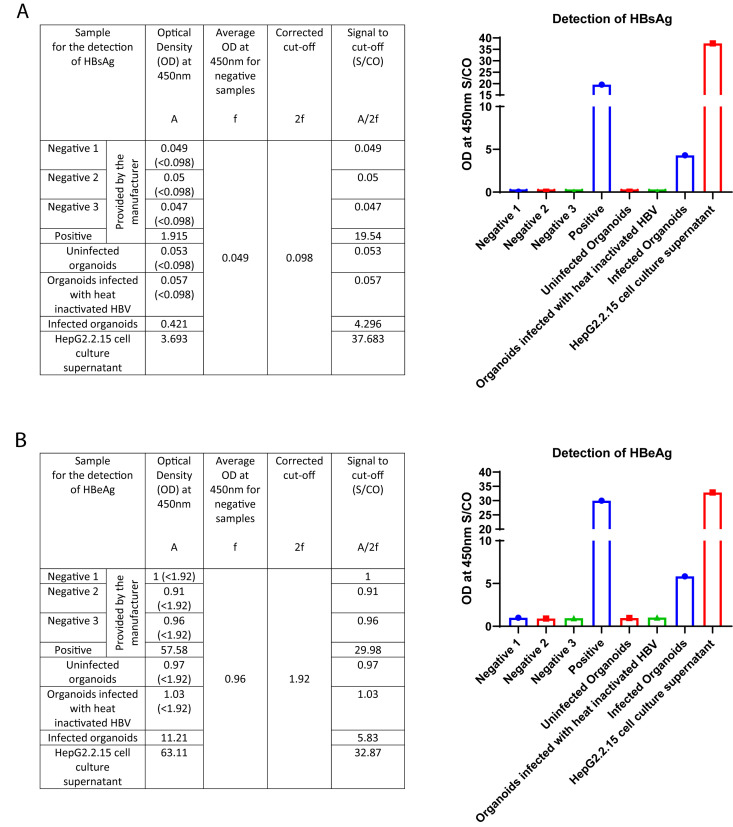
Figure 8. Expected results for the detection of HBsAg and HBeAg.
A) Absorbances to detect HBsAg, measured as OD450 for the different samples, calculation of the corrected cut-off value using absorbances of the negative samples provided by the kit manufacturer, and the signal to cut-off values for the different samples, as well as the bar diagram depicting the expressions of HBsAg in the different samples. The y-axis represents the OD at 450 nm S/CO and the x-axis represents the different samples. B) Absorbances to detect HBeAg measured as OD450 for the different samples, calculation of the corrected cut-off value using absorbances of the negative samples provided by the kit manufacturer, and the signal to cut-off values for the different samples, as well as the bar diagram depicting the expressions of HBeAg in the different samples. The y-axis represents the OD at 450 nm S/CO, and the x-axis represents the different samples.

