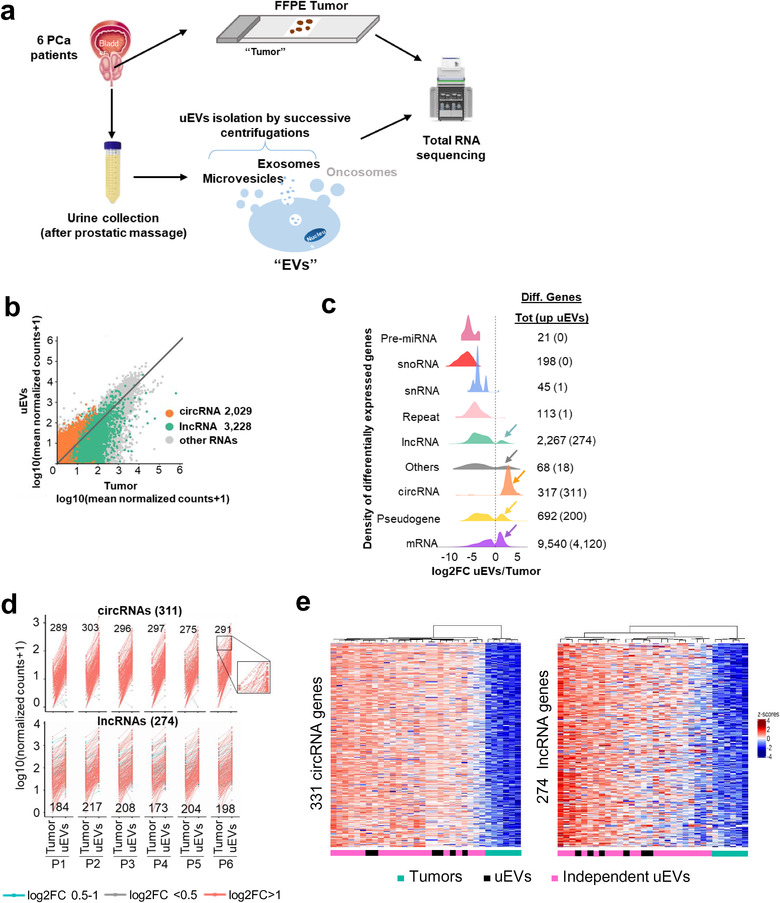
FIGURE 1.

uEVs are enriched in circRNAs and some lncRNAs. (a). Full transcriptome of paired liquid and solid biopsies of prostate cancer patients. Experimental procedure from prostate tumour biopsies and urines collections to RNA sequencing, through FFPE biopsies and uEVs isolation. (b). Mean gene expression of paired Tumour against uEVs (n = 83,980 RNAs if at least one counts, n = 21,397 if at least five counts for cirRNAs and 20 counts for lncRNAs and other RNAs). DEseq2 normalized counts, for each type of RNA are plotted; circRNAs (orange), lncRNAs (green), all other types of RNAs (grey). Each dot represents all transcripts for each gene. R2 = 0.35 and R2 = 0.16 for 2029 circRNAs and 3228 lncRNAs, respectively (> = 5 counts for cirRNAs, > = 20 counts for lncRNAs and other RNAs). (c). Density plot showing the distribution of log2 fold change uEVs/Tumour ratio per gene types. The right side of dotted line correspond to enriched genes in uEVs compared to Tumour tissues. The left side of dotted line correspond to the enriched genes in tumours compared to uEVs. Each colour represents an RNA type. Number of total differentially enriched genes in Tumour and uEVs are indicated on the right with the number of enriched RNA in EVs in bracket. (d). Interaction between the normalized number of counts of the 311 upregulated circRNAs (top) and 274 upregulated lncRNAs (bottom) in paired Tumour and uEVs for each patient (P1 to P6). Each dot corresponds to a circRNA or lncRNA upregulated in uEVs compared to Tumour with Log2 FC = 0,5–1 (blue), Log2 FC < 0,5 (grey), Log2 FC > 1 (red). The number of counts for the same RNA, in Tumour and in uEV are linked together with a line as shown for four circRNAs in the zoom window of patient 6. For each patient are indicated the numbers of circRNA and lncRNA with a log2(FC) > 1. (e). Heatmap display unsupervised hierarchical clustering with euclidean distance (CED) of 311 circRNAs (left) and 274 lncRNAs (right) up regulated in uEVs (FC > = 1.5, at least 20 counts) in each of the individual samples from six Tumour biopsies (green), paired six uEVs (black) and 20 independent uEVs (pink) from prostate cancer patients. Colour scales represent z‐scores of log10(TPM+1)
