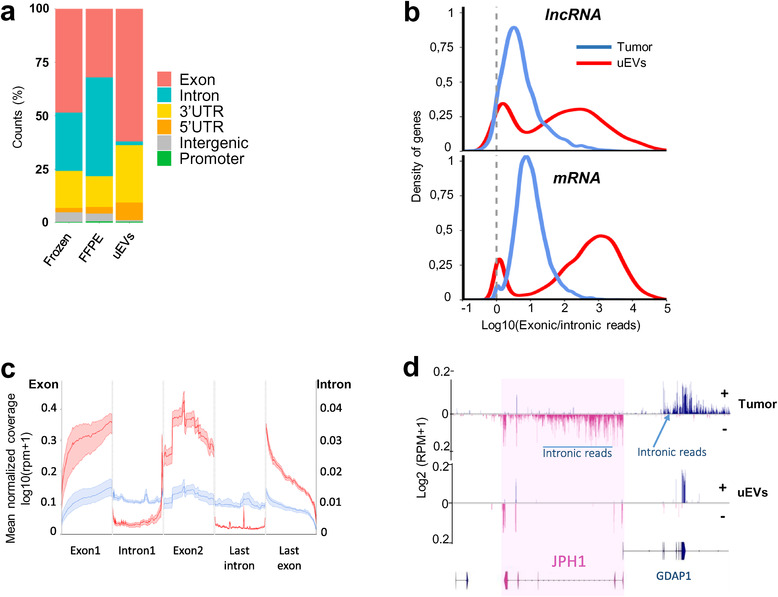
FIGURE 2.

Intronic RNAs are depleted in uEVs compared to Tumour. (a). Genomic read counts distribution by percentage across exon, intron, 3′UTR, 5′UTR, intergenic and promoter in frozen, FFPE and uEVs biopsies. (b). Distribution of log10(exonic read counts/intronic read counts) normalized by length from Tumour (blue) and uEVs (red) samples for lncRNA (top, 2151 in tumours, 1393 in uEVs) and mRNA (bottom, 13,084 in tumours, 11,483 in uEVs) annotations. (c). Metagene of mean coverage for two first exons, last exon, first intron and last intron of 25,166 mRNAs and lncRNAs from Tumour (blue) and uEVs (red) samples. (d). GGbio‐generated RNA read profiling along minus (−; pink) and plus (+; bleu) strands of chr8:74198516–74398516 in Tumour and uEVs specimens. Arrow lines represent introns and rectangles represent exons of GENCODE‐annotated protein‐coding gene JPH1 (pink) and part of GDAP1. The maximum value of coverage, read count is shown in the left panel of read mapping. Some intronic reads are indicated for the two genes
