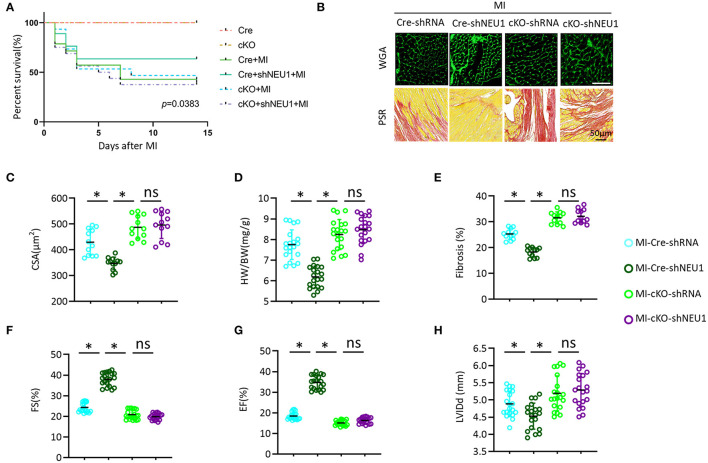
Figure 8.
PGC1α deficiency offset the protective effects of shNEU1 in vivo. (A) Kaplan–Meier survival analysis of each group in 2 weeks after MI (n = 20). (B) WGA staining and PSR staining of each group mice heart (n = 12). (C) Statistical results for the cross-sectional areas of myocytes (CSA, n =100 cells/sample, n = 12 per group). (D) Statistical results of HW/BW (n = 20). (E) Quantification of fibrotic areas in 8 weeks post-MI (n = 12). (F) FS of mice in 8 weeks post MI (n = 20). (G) EF of mice in 8 weeks after MI (n = 20). (H) LVIDd diameter (n = 20). *P < 0.05 vs. corresponding group; n.s., non-significant.

