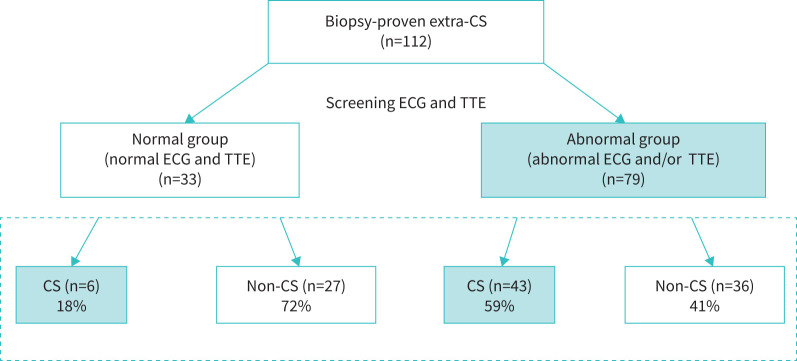
FIGURE 2.
Study flow and prevalence of cardiac sarcoidosis. A flow diagram illustrating the classification of normal and abnormal groups based on the ECG and TTE results. Six of the 33 patients (18%) in the normal group and 43 of the 79 patients (59%) in the abnormal group were diagnosed with CS on the basis of Japanese guidelines, with a significantly higher frequency in the abnormal group (p=0.0004). CS: cardiac sarcoidosis; ECG: electrocardiography; TTE: transthoracic echocardiography.

