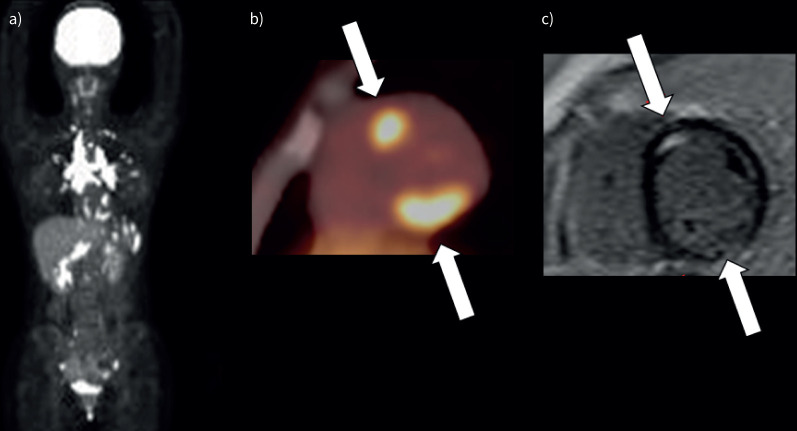
FIGURE 4.
Representative images (multiorgan involvement) (patient 5 in table 2). a) Maximum intensity projection 18F-fluoro-deoxyglucose positron emission tomography (18F-FDG PET) image shows 18F-FDG uptake in the mediastinal, bilateral hilar and abdominal lymph nodes, spleen and heart. b) 18F-FDG PET image shows focal myocardial 18F-FDG uptake in the mid-segments of the anteroseptal and inferior walls (arrows). c) Late gadolinium-enhanced magnitude inversion recovery image in the short axis shows hyperenhancements in the mid-segments of the anteroseptal and inferior walls (arrows).

