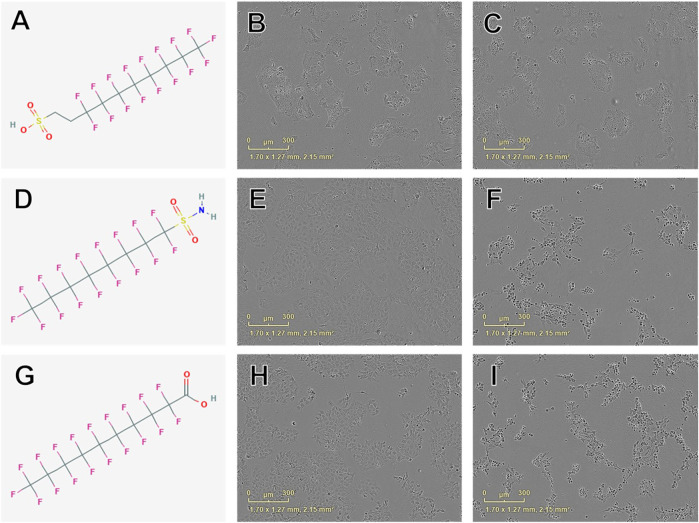
FIGURE 2.
Examples of chemical structures and corresponding phase contrast live cell images obtained from JEG-3 cells after 24 h exposure to PFAS with most pronounced effects on cellular viability. (A) Structure of 8:2 fluorotelomer sulfonic acid (39108-34-4; viability EC50 ± SE: 160 ± 46 µM); (B) Image of cells exposed to 300 µM 39108-34-4; (C) Image of cells exposed to 500 µM 39108-34-4; (D) Structure of perfluorooctanesulfonamide (754-91-6; EC50 ± SE: 176 ± 5 µM); (E) Image of cells exposed to 150 µM 754-91-6; (F) Image of cells exposed to 300 µM 754-91-6; (G) Structure of perfluorodecanoic acid (335-76-2; EC50 ± SE: 181 ± 26 µM); (H) Image of cells exposed to 250 µM 335-76-2; (I) Image of cells exposed to 350 µM 335-76-2. Mild to moderate cell stress is apparent in (B), (E), and (H) marked by darkened, condensed nuclei and increased fibroblastic projections. Moderate to severe cell stress and death is apparent in (C), (F), and (I).

