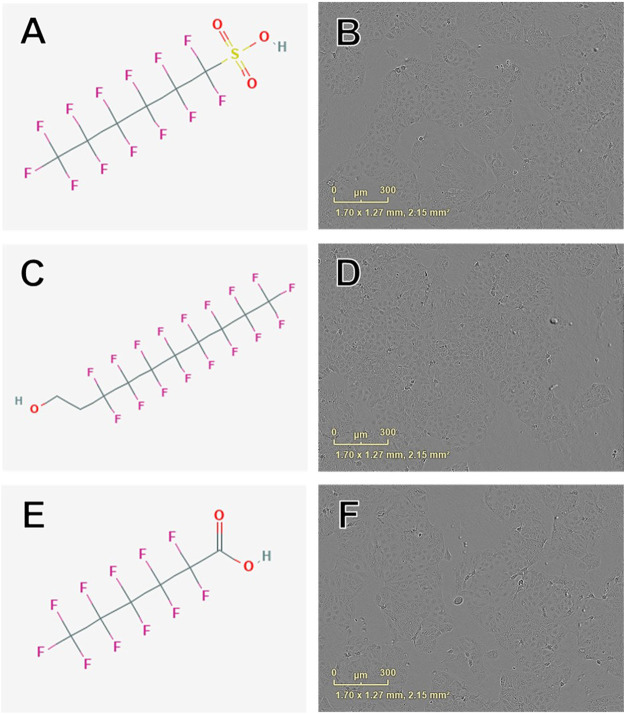
FIGURE 4.
Examples of chemical structures and corresponding phase contrast live cell images obtained from JEG-3 cells after 24 h exposure to PFAS with most pronounced effects on mitochondrial membrane potential. (A) Structure of perfluorohexanesulfonic acid (355-46-4; EC50 ± SE: 86.2 ± 72.3 µM); (B) Live cell image of cells exposed to 150 µM 355-46-4; (C) Structure of 6:2 fluorotelomer alcohol (678-39-7 EC50 ± SE: 95.4 ± 17.1 µM); (D) Image of cells exposed to 50 µM 678-39-7; (E) Structure of perfluorohexanoic acid (307-24-4; EC50 ± SE: 140.9 ± 11.10 µM); (F) Image of cells exposed to 150 µM 307-24-4. No overt cell death is apparent in (B), (D), or (F).

