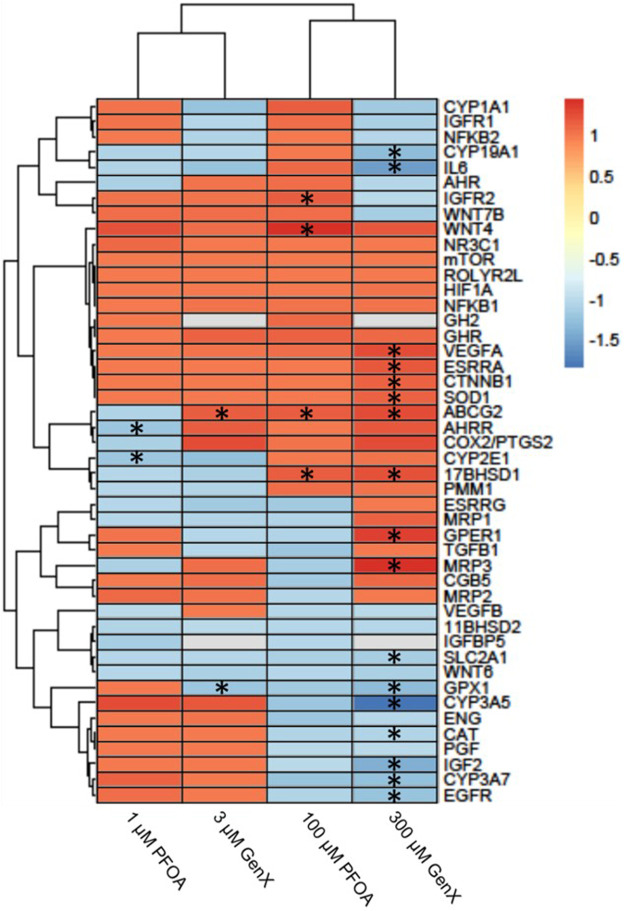
FIGURE 6.
Heatmap illustrating gene expression changes in a set of 46 genes evaluated in JEG‐3 cells after exposure to PFOA or GenX for 24 h. Fold‐change is indicated by the scale bar and colors on the heatmap, with grey indicating genes with mRNA counts below the detection threshold due to suboptimal probe hybridization (GH2 and IGFBP5). Experimental group fold‐change values were compared to corresponding vehicle control group fold‐change values by ANOVA. Asterisks indicate significant shifts in gene expression at a false discovery rate of *p < 0.05 (N = 3 biological replicates).

