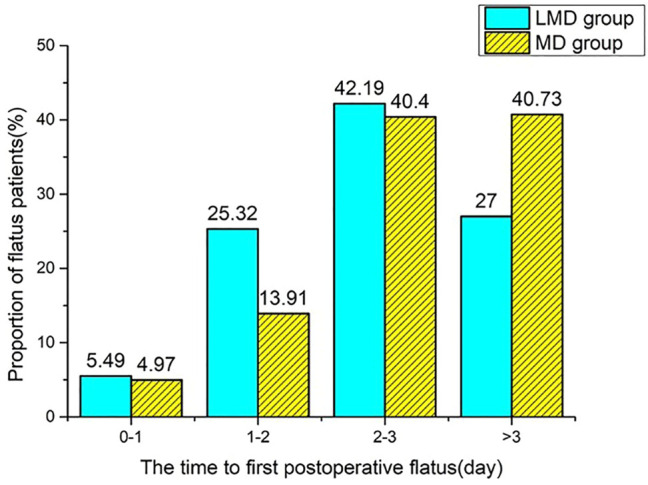
FIGURE 2.

The proportion of flatus patients at each time point (less than or equal to 1 day, denoted as 0–1; greater than 1, less than or equal to 2 denoted as 1–2; greater than 2, less than or equal to 3 denoted as 2–3). Compared with the MD group, the LMD group had more patients with the first flatus time less than 3 days (73.00% vs. 59.28%), p < 0.05.
