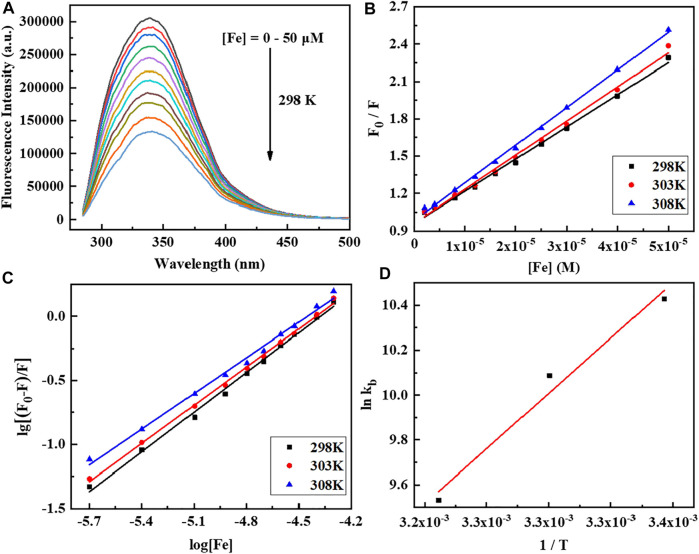
FIGURE 3.
(A) Fluorescence emission spectra of human serum albumin (HSA) (10 μM) titration with the Fe complex by increasing concentrations (0–50 μM). The excitation wavelength is 280 nm at pH 7.5 and 303 K. (B,C) Stern–Volmer plot of HSA quenched by the Fe complex at different temperatures. (D) Van’t Hoff plot of lnK b vs. 1/T for the interaction of the Fe complex with HSA.

