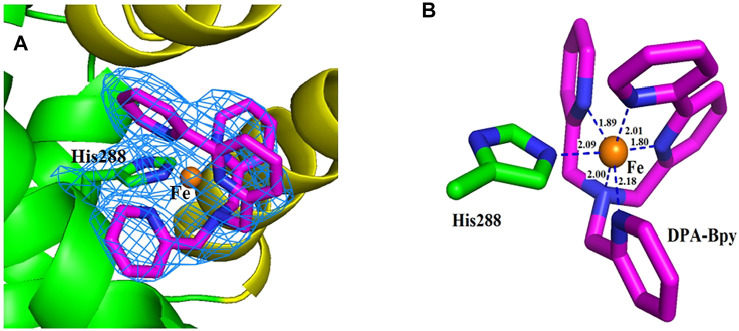
FIGURE 6.
Close view of the electron density map (2Fo−Fc) of the binding site for the Fe complex. The map is contoured at 1.0 σ and shown as a skyblue mesh (A). Nearest residue to the Fe complex is shown as green sticks. The ligand molecule is shown as pink sticks and Fe ion is shown as brown spheres (B). Distances between the atoms are shown as blue dash lines; respectively.

