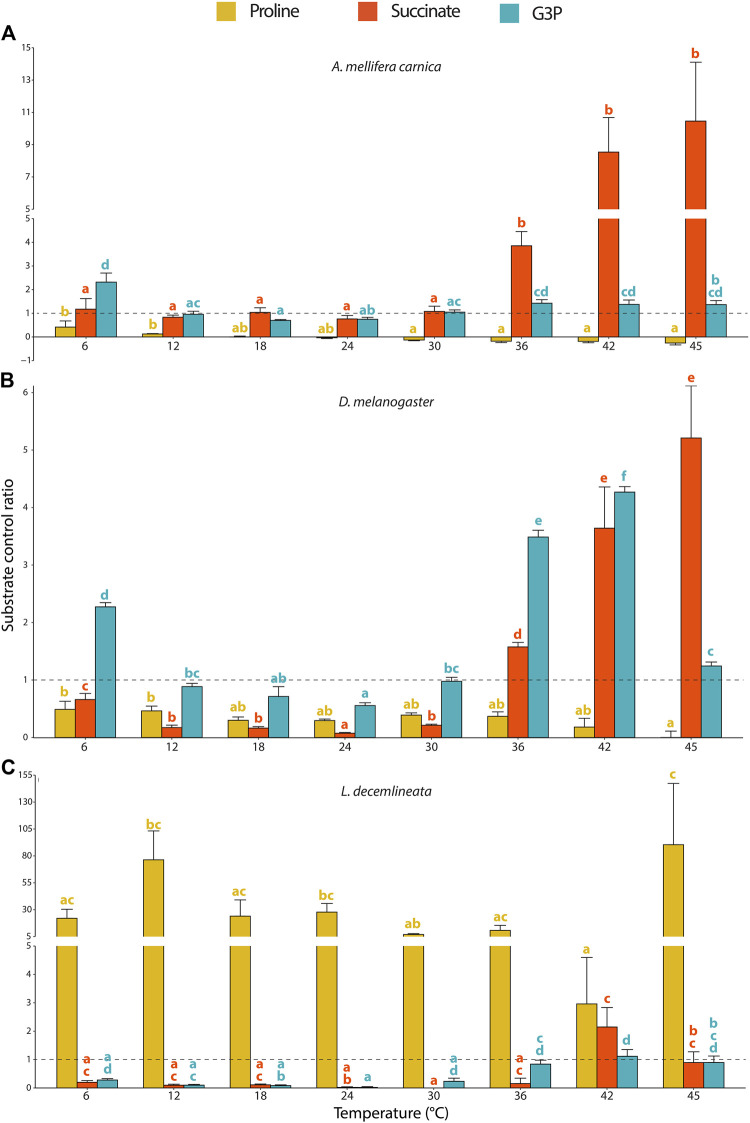
FIGURE 3.
Substrate contribution ratio (SCR) for proline, succinate and G3P calculated from mitochondrial oxygen consumption rates measured in permeabilized thoraces of the three insect species. (A) A. mellifera carnica (n = 8–10), (B) D. melanogaster (n = 5–10), and (C) L. decemlineata (n = 4–10). Substrate contribution ratios were calculated as SCR=(OCR2-OCR1)/OCR1 where OCR1 represents the oxygen consumption rate prior to the injection of substrate x and OCR2 corresponds to the oxygen consumption rate after the injection of substrate x; SCR = 1.0 is represented with a dashed line and indicates that OCR increased by 100% (doubled) after injection of a specific substrate. Substrate contribution ratios are reported as mean ± s.e.m. and were compared within species for each substrate and between assay temperatures using a one-way ANOVA followed by a HSD (Honest Significant Difference) Tukey’s test. Dissimilar letters indicate significant differences between assay temperatures (yellow for proline, red for succinate and blue for G3P) for each species. In honeybees (proline) and beetles (succinate and G3P), one-way ANOVA conditions were not met, and a non-parametric test (Kruskall-Wallis) followed by a Dunn’s test were performed.

