. 2018 Jun 28;8(42):23567–23577. doi: 10.1039/c8ra04112a

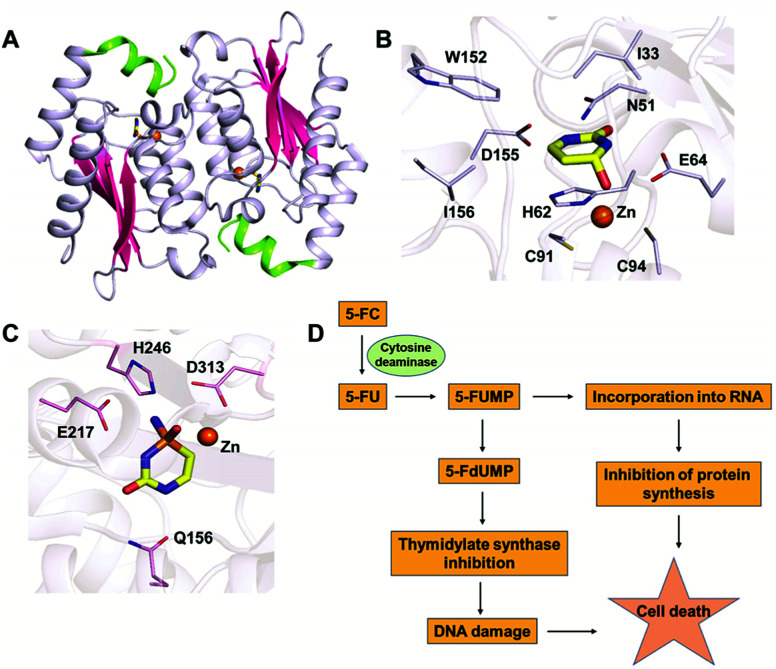
Fig. 2. Structural analysis of CD. (A) Cartoon representation of yCD (PDB ID: 1UAQ). α-helices are shown in blue-white, while β-strands are shown in pink. The C-terminal helix 6, which serves as a gate, is highlighted in green. (B) Active site representation of yCD in complex with 3,4-dihydrouracil. (C) Active site of eCD of the AHS superfamily (PDB ID: 3O7U) in complex with the transition state inhibitor phosphonocytosine. Carbon atoms of the interacting residues are shown in blue-white in yeast CD and in light pink in E. coli CD. The carbon atoms of the ligand are shown in yellow in all the complexes, whereas zinc is shown as an orange sphere. (D) Schematic of the mechanism of action of 5-fluorocytosine (5-FC) in suicide gene therapy employing CD.

Fig. 2