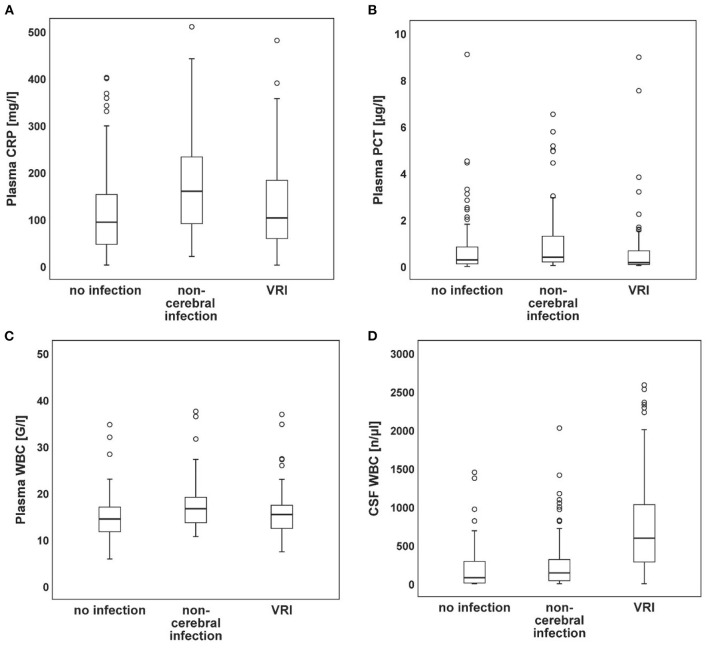
Figure 2.
Peak values of plasma and CSF-derived parameters. Box plots of CRP (A), PCT (B), plasma WBC (C), and CSF WBC (D) peak values showing the median (horizontal line), the first and third quartile (lower and upper end of box), the minimum and maximum (whiskers), and outliers (circles; values outside 1.5 times the interquartile range).

