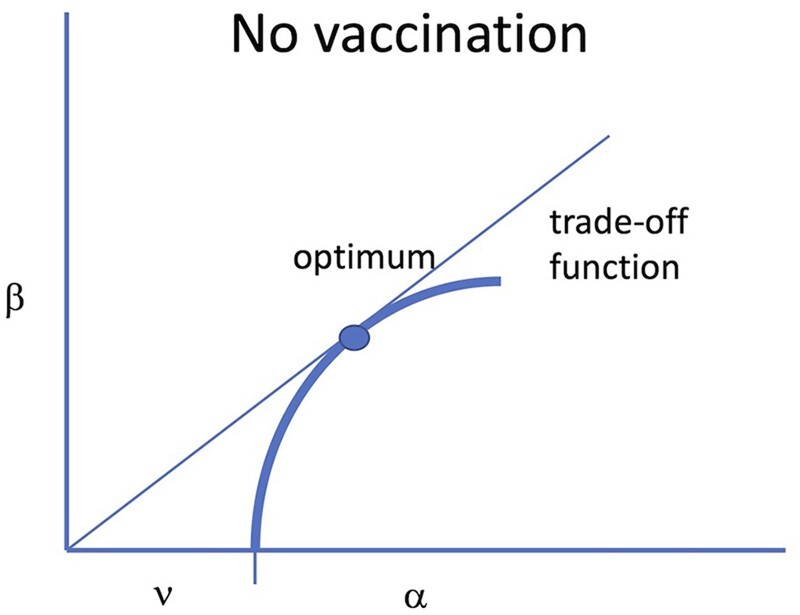
Figure 1.

Trade-off model in which transmission rate imposes host mortality. The vertical axis is transmission rate (β) and the horizontal axis is the rate at which the infection is lost, due to a combination of host death (α) and recovery (ν). A line from the origin to any point in the space has slope β/(ν + α) and thus is proportional to the basic reproductive number (R0) of a virus with those parameter values. The blue curve represents a possible trade-off that the biology might impose on a virus, such that the virus cannot attain any value outside of the curve (to the upper left). The optimum is the highest value of R0 that the virus might attain, represented by the point at which a line through the origin is tangent to the trade-off and shown as a solid dot. In the models here and in GMNR, recovery is assumed to be independent of transmission, so the trade-off curve is bounded by ν on the horizontal axis because changes in β are assumed to affect only mortality, α. This illustration accrues to the absence of a vaccine
