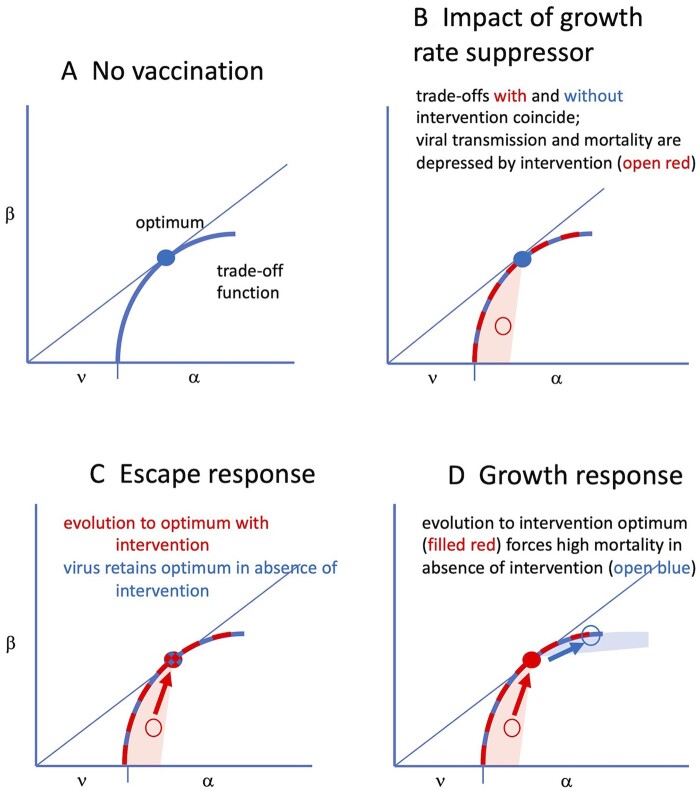
Figure 3.
Effect of and response to an intervention that reduces viral growth rate. (A) Initially, the virus has evolved to its optimum in the absence of interventions (filled blue circle, as in Fig. 1). (B) The inhibitor suppresses viral growth rate, thereby reducing virulence (α) and reducing transmission rate (β). The performance of the inhibited virus will necessarily be suppressed to lie in a zone below and to the left of the optimum, given by open red. The trade-off itself is unaffected by the inhibitor—only the virus is affected, hence the red and blue trade-offs coincide. (C) The consequences of evolution to escape the inhibitor are interpreted as a virus that is no longer affected by the inhibitor. Coordinates of the virus optimum in the absence of the inhibitor coincide with those of the evolved virus in the presence of the inhibitor. Evolution to an optimum in the presence of the inhibitor is simply a return to the coordinates of the former optimum (the filled red and blue dot). (D) The alternative pathway of evolving a higher growth rate in response to the inhibitor leads to a new optimum in the presence of the inhibitor (filled red circle), but the evolved growth rate is higher than optimal when the inhibitor is absent (open blue). Evolution of a higher growth rate is thus potentially very harmful to hosts lacking the inhibitor. Although this figure depicts escape and growth responses as alternatives, the viral response could be a combination of escape and growth

