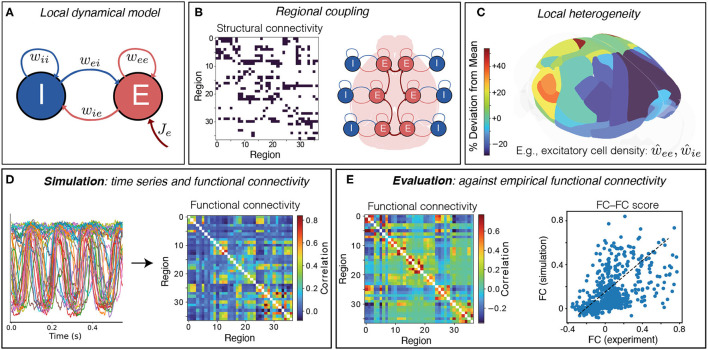
Figure 1.
Simulating and evaluating a coupled neural-mass model of mouse cortical dynamics. (A) The dynamics of individual brain regions follow the Wilson–Cowan equations (Wilson and Cowan, 1972, 1973) which govern interactions between local excitatory (E) and inhibitory (I) neural populations. (B) Regions are coupled together by connections defined by the AMBCA (Oh et al., 2014), represented as a directed adjacency matrix (connections shown black). A schematic shows how these long-range structural connections couple local cortical regions via excitatory projections (Breakspear, 2017). (C) Heterogeneity in local model parameters can be introduced as a perturbation that follows the measured variation in excitatory and inhibitory neural densities. Here the variation in excitatory cell density is plotted across the 37 mouse cortical areas as deviations relative to the mean level (green), using brainrender (Claudi et al., 2021) and data from Erö et al. (2018). (D) Model simulation yields activity time series for each brain region, from which pairwise linear correlations (functional connectivity, FC) are computed. (E) Model simulations are evaluated against empirical FC, averaged across 100 mice, as the Spearman correlation between all unique pairwise FC values, yielding an FC–FC score, ρFCFC.

