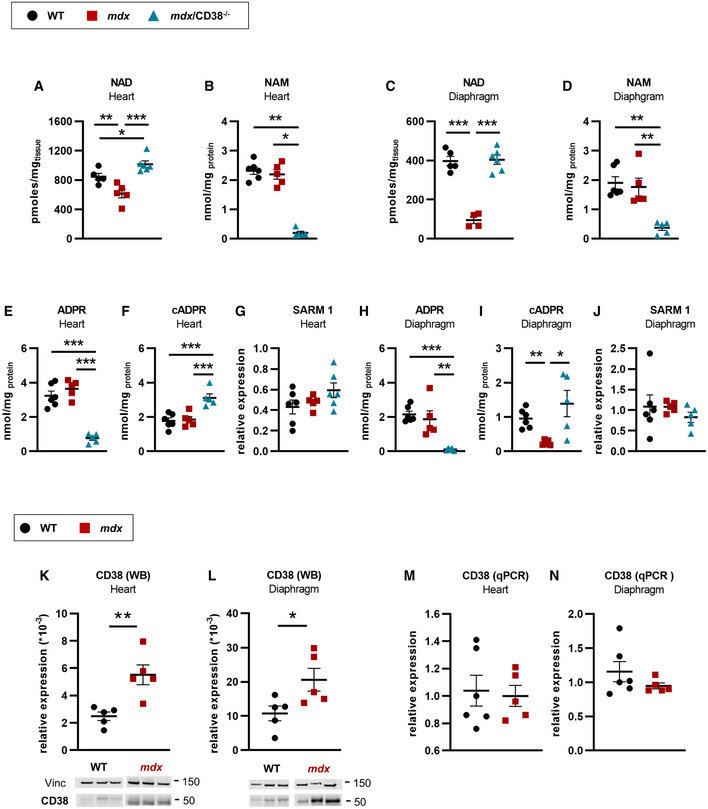
Figure 1. Restoration of NAD+ levels in mdx/CD38 −/− mice.

-
A, BNAD and nicotinamide (NAM) levels in the heart of WT (n = 5 and n = 6, respectively), mdx (n = 5 and n = 5, respectively), and mdx/CD38 −/− (n = 6 and n = 5, respectively) mice.
-
C, DNAD and NAM levels in diaphragm of WT (n = 5 and n = 6, respectively), mdx (n = 4 and n = 5, respectively), and mdx/CD38 −/− (n = 6 and n = 5, respectively) mice.
-
E–GLevels of ADP‐ribose (ADPR) (E), cyclic ADP‐ribose (cADPR) (F) expressed as nmol/mg protein, and (G) qPCR analysis of mRNA levels of sterile alpha and Toll/interleukin‐1 receptor motif‐containing 1 (SARM1) in the heart of WT (n = 6), mdx (n = 5) and mdx/CD38 −/− (n = 5, n = 5, and n = 6, respectively) mice.
-
H–JLevels of ADPR (H), cADPR (I) expressed as nmol/mg protein, and (J) qPCR analysis of mRNA levels of SARM1 in the diaphragm of WT (n = 6), mdx (n = 5) and mdx/CD38 −/− (n = 5) mice.
-
K, LWestern blot analysis of CD38 protein expression in heart (K) and diaphragm (L) of WT (n = 5 and n = 6, respectively) and mdx (n = 5) mice. Vinculin is used as housekeeping protein control, and the dot plots show the ratio of CD38 to vinculin.
-
M, NqPCR analysis of CD38 mRNA levels in the heart (M) and diaphragm (N) of WT (n = 6) and mdx (n = 5) mice.
Data information: A–N: Each dot of the graphs represents a mouse and is measured in duplicate except for K,L, a value/mouse. After normality and variance comparison tests, significance was assessed using: A,C,E,F,G,H: ANOVA followed by Fisher's LSD test; B: the Kruskal–Wallis test followed by Dunn's test; D: the Kruskal–Wallis followed by the Mann–Whitney tests; I: Welch’s ANOVA followed by Welch’s t‐tests; J: ANOVA; K,L,M: unpaired Student’s t‐test; and N: unpaired Welch’s t‐test. Values are expressed as means ± SEM. Significance: *P < 0.05, **P < 0.01, and ***P < 0.001.
Source data are available online for this figure.
