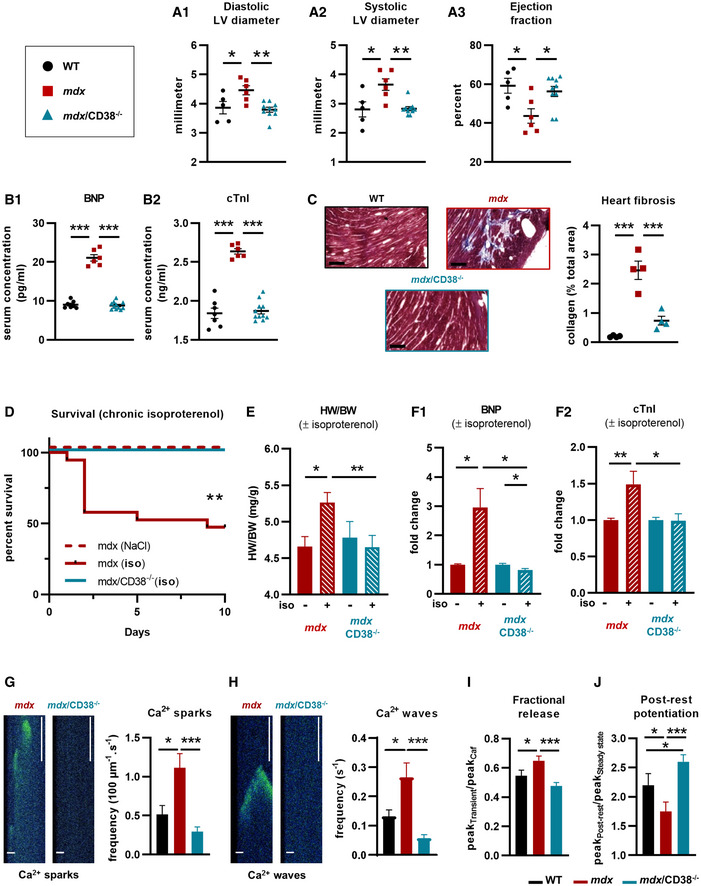
Figure 2. Deletion of CD38 prevented heart dysfunction and reduces spontaneous Ca2+ activity in isolated cardiomyocytes of mdx/CD38 −/− mice.

-
ACardiac function evaluated by echocardiography in mdx/CD38 −/− mice: The dot plots show the left ventricular (LV) diastolic (A1) and systolic (A2) inner diameters and LV ejection (A3) fraction in 7‐month‐old WT (n = 5), mdx (n = 6), and mdx/CD38−/− (n = 10) mice.
-
BPlasma levels of cardiac stress biomarkers: brain natriuretic peptide (BNP) (B1) and cardiac troponin I (cTnI) (B2) in 7‐month‐old WT (n = 7), mdx (n = 6), and mdx/CD38 −/− (n = 11) mice.
-
CCropped images revealed the collagen (blue) stained by Masson’s trichrome staining in the heart of WT, mdx, and mdx/CD38 −/− mice. Dot plot showing the quantification of heart collagen staining area (% total area) in 7‐month‐old WT, mdx, and mdx/CD38 −/− mice (n = 4 per group). Scale bars: 200 µm.
-
DIsoproterenol‐induced heart failure in 3‐month‐old mice. The Kaplan–Meier curve shows the survival rate of mdx mice (NaCl, n = 5), and mdx (n = 19) and mdx/CD38 −/− (n = 9) mice following isoproterenol (iso, subcutaneous injection) at 2.5 mg/kg/d for 10 days.
-
EHistogram showing isoproterenol‐induced heart hypertrophy in mdx NaCl (n = 5) mice, and surviving mdx (isoproterenol, n = 9), mdx/CD38 −/− NaCl (n = 9), and mdx/CD38 −/− (isoproterenol, n = 9) mice, expressed as heart weight/body weight ratio (HW/BW).
-
FPlasma levels of cardiac stress biomarkers: brain natriuretic peptide (BNP) (F1) and cardiac troponin I (cTnI) (F2) following isoproterenol treatment in mdx NaCl (n = 5), and surviving mdx (isoproterenol, n = 8), mdx/CD38 −/− NaCl (n = 5), and mdx/CD38 −/− (isoproterenol, n = 8) mice.
-
G, HTime‐lapse images recorded by confocal microscopy in “line‐scanning mode”, showing Ca2+ sparks and waves in cardiomyocytes at rest, extracted from mdx and mdx/CD38 −/− mice; scale bars: 10 µM (horizontal), 500 ms (vertical). Bar graphs showing the averaged Ca2+ spark (G) and wave (H) frequencies in cardiomyocytes isolated from WT (n = 21 cells), mdx (n = 28 cells), and mdx/CD38 −/− (n = 32 cells) mice.
-
IBar graph showing the fractional release following caffeine application in cardiomyocytes from WT (n = 24 cells), mdx (n = 33 cells), and mdx/CD38 −/− (n = 32 cells) mice.
-
JBar graph showing the post‐rest potentiation in cardiomyocytes from WT (n = 24 cells), mdx (n = 28 cells), and mdx/CD38 −/− (n = 32 cells) mice.
Data information: A,B,C: Each dot of the graphs represents a mouse. A,F in duplicate; C in triplicate; and D,E one value/mouse. G,H,I,J: experiments performed in three mice of each group. After normality and variance comparison tests, significance was assessed using: A1,B1,B2,C,I: ANOVA followed by Fisher's LSD test; A2,A3,G,H,J: the Kruskal–Wallis test followed by Dunn’s test; D: the log‐rank Mantel–Cox test and the log‐rank test for trend and the Gehan–Breslow–Wilcoxon test; E,F2: the Kruskal–Wallis test followed by the Mann–Whitney tests; and F1: ANOVA followed by Student’s/ Welch’s t‐tests. Values are expressed as means ± SEM. Significance: *P < 0.05, **P < 0.01, and ***P < 0.001.
Source data are available online for this figure.
