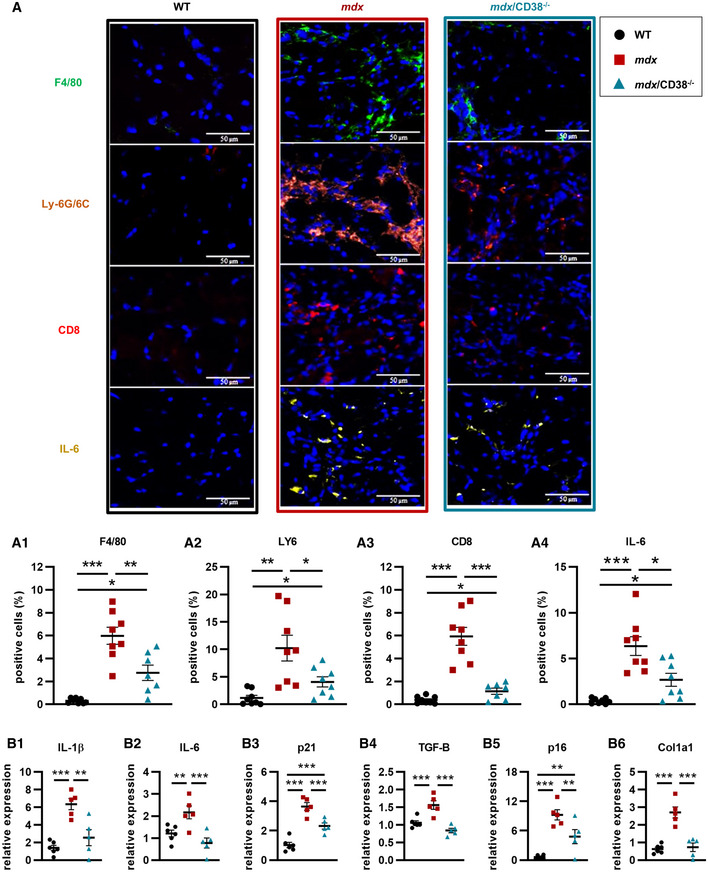
Figure 4. Deletion of CD38 reduced cell infiltrations and inflammation markers in diaphragm in mdx/CD38 −/− mice.

- Images showing immunostaining of myeloid cells showing F4/80 (macrophage marker), Ly‐6G/6C (monocyte, granulocyte, and neutrophil marker), CD8 (cytotoxic T‐lymphocyte marker), and IL‐6‐positive cells in the diaphragm of 7‐month‐old WT (n = 8), mdx (n = 8), and mdx/CD38 −/− (n = 7 or 8) mice. Lower panel: histograms quantifying the percentage of F4/80 (A1) mdx/CD38 −/− (n = 7), LY6 (A2) mdx/CD38 −/− (n = 8), CD8 (A3) mdx/CD38 −/− (n = 7), and IL‐6 (A4) mdx/CD38 −/− (n = 8)‐positive cells. Scale bars: 50 µm.
- qPCR analysis of mRNA levels of interleukin‐1β (IL‐1ß) (B1) and interleukin‐6 (IL‐6) (B2), cyclin‐dependent kinase inhibitor 1 (p21) (B3), transforming growth factor‐β (TGF‐β) (B4), senescence markers (cell‐cycle inhibitor p16, INK4a) (B5), and collagen type I alpha 1 chain (Col1a1) (B6) in diaphragm of 20‐month‐old WT (n = 6), mdx (n = 5), and mdx/CD38 −/− (n = 5) mice.
Data information: A,B: Each dot of the graphs represents a mouse. A one value/mouse; and B in duplicate. After normality and variance comparison tests, significance was assessed using: A1–4: Welch’s ANOVA followed by Welch’s t‐tests and B1–6: ANOVA followed by Fisher's LSD test. Values are expressed as means ± SEM. Significance: *P < 0.05, **P < 0.01, and ***P < 0.001.
Source data are available online for this figure.
