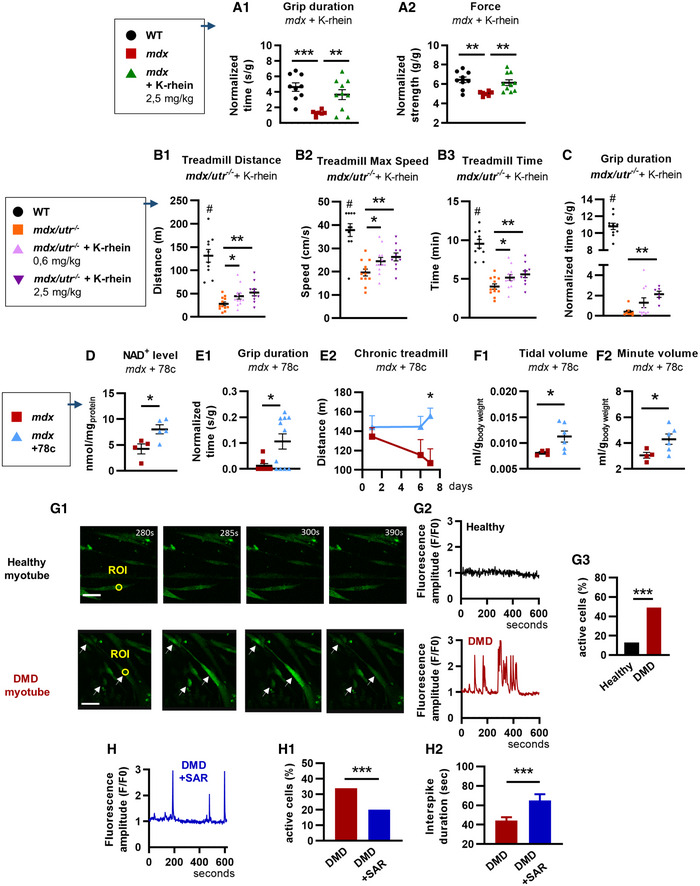
Figure 6. Beneficial effects of the pharmacological inhibition of CD38 in mdx mice and human DMD myotubes.

-
AYoung mdx mice and treatment with a CD38 inhibitor. 6‐week‐old mdx mice were treated for 5 weeks with K‐rhein at 2.5 mg/kg/d by intraperitoneal injection. Dot plots showing measurement of the grip duration (A1) and the force (A2) of WT (n = 9), mdx (n = 7), and K‐rhein‐treated mdx (n = 10) mice.
-
B, CNewborn double‐knockout utrophin–dystrophin (mdx/utr −/−) mice and treatment with an CD38 inhibitor. Mdx/utr −/− mice were subcutaneously injected with K‐rhein (0.6 and 2.5 mg/kg/d) for 4 weeks. B: Dot plots showing the treadmill performances of K‐rhein‐treated mdx/utr −/− mice: distance traveled (B1), maximum speed reached (B2), and maximum running time (B3) (WT (NaCl) and mdx/utr −/− + K‐rhein 2.5 mg/kg/d, n = 10 mice per group; mdx/utr −/−(NaCl) and mdx/utr −/− + K‐rhein 0.6 mg/kg/d, n = 12 mice per group). C: Measurement of the grip duration (grid test) in WT (n = 10), mdx/utr −/− (n = 8), and K‐rhein‐treated mdx/utr −/− mice (n = 10 and 6 mice, respectively, for the 0.6 mg/kg/d and 2.5 mg/kg/d doses).
-
D–FAdult mdx mice and long‐term treatment with an CD38 inhibitor. Mdx mice were evaluated after 6 months of intraperitoneal injection with the CD38 inhibitor 78c (10 mg/kg/d). D: Histogram showing NAD+ levels in the limb of mdx (n = 4) and 78c‐treated mdx (n = 5) mice. E: Histogram showing grip duration (E1) (n = 8 mdx and n = 11) in the inverted grid test and performances in chronic treadmill test (E2) at days 1, 6, and 7 after treatment of mdx (n = 5 except for D7, n = 4) and 78c‐treated mdx (n = 7) mice. F: Dot plots showing barometric plethysmography measures of the tidal (F1) and minute (F2) volumes of mdx (n = 4) and 78c‐treated mdx (n = 6) mice.
-
GTime‐lapse confocal imaging of calcium dynamics in human healthy and DMD myotubes loaded with the Ca2+‐sensitive dye Fluo‐4 (white arrows show the active cells) (G1). Traces illustrating recordings from region of interest (ROI) in an inactive healthy myotube (black line) and in a DMD myotube displaying Ca2+ spiking activity (red line) (G2). Histogram showing the percentage of myotubes displaying spontaneous Ca2+ waves (G3): healthy myotubes (n = 91 cells) and DMD myotubes (n = 186 cells). Scale bars: 200 µm.
-
HHuman DMD myotubes treated by SAR650984 (SAR, isatuximab), a humanized anti‐CD38 antibody. Fluorescence trace illustrating a recording of DMD myotubes treated with 10 µg/ml of SAR (blue). Histogram showing the percentage of spontaneous Ca2+ waves in DMD myotubes untreated (n = 740 cells) or treated with 10 µg/ml of SAR (n = 279 cells) (H1). Histogram showing the Ca2+ wave interspike duration (interval between spikes) in myotubes treated with 10 µg/ml of SAR (n = 43 cells vs 91 for the untreated DMD myotubes) (H2).
Data information: A–F: Each dot of the graphs represents a mouse. A1,B one value/mouse; D,E,F in duplicate; and A2,C in triplicate. After normality and variance comparison tests, significance was assessed using: A1: Welch’s ANOVA followed by Welch’s t‐tests; A2, B1–3: ANOVA followed by Fisher's LSD test; C: the Kruskal–Wallis followed by Dunn's test; D: unpaired Student’s t‐test; F2,E1: an unpaired Mann–Whitney test; E2: two‐way ANOVA; F1,H2: unpaired Welch’s t‐test; and G3,H1: the chi‐square test Values are expressed as means ± SEM. Significance: *P < 0.05, **P < 0.01, ***P < 0.001, and # P < 0.001 vs mdx/utr −/−.
Source data are available online for this figure.
