
Figure EV1. VEGF level correlates with disease progression of COVID‐19.
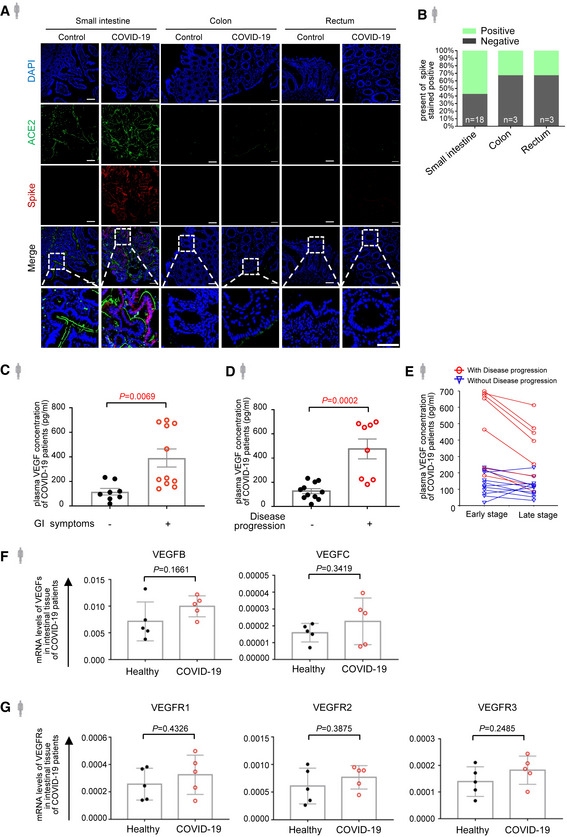
- Immunofluorescence analysis of ACE2 and SARS‐CoV‐2 spike protein in the intestinal tissues of COVID‐19 patients. ACE2 staining in green, spike protein staining in red and nuclear staining in blue. Scale bars, 50 µm.
- The percentage of spike stained positive in different parts of the intestinal tissues from patients with COVID‐19. Number of samples for each group as indicated.
- ELISA analysis of VEGF concentration in plasma of COVID‐19 patients with (n = 11) or without (n = 8) GI symptoms.
- ELISA analysis of VEGF concentration in plasma of COVID‐19 patients with (n = 8) or without (n = 11) disease progression.
- Temporal course of plasma VEGF at the early and late stage of COVID‐19 infection by ELISA analysis. Data shown are the levels of plasma VEGF in patients with (n = 8) and without (n = 11) disease progression at the early stage (one to three days after laboratory‐confirmed for COVID‐19) and late stage (more than three days after laboratory‐confirmed for COVID‐19).
- mRNA levels of VEGF‐B and VEGF‐C in the intestinal tissues from COVID‐19 patients (n = 5) or healthy controls (n = 5) by RNA‐seq.
- mRNA levels of VEGFR1, VEGFR2, and VEGFR3 in the intestinal tissues from COVID‐19 patients (n = 5) or healthy controls (n = 5) by RNA‐seq.
Data information: All data are shown as mean ± SD. P values are determined by Student’s t‐test.