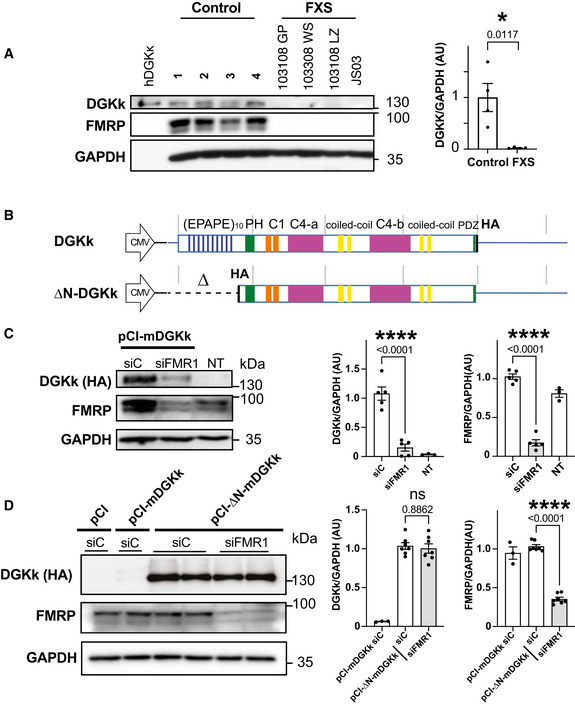
Figure 1. DGKk expression is altered in FXS, and FMRP is required for translation control via its N‐terminal region.

-
AWestern blot analysis of lysates from cerebellum of control and FXS patients “FXS” (n = 4). Extract of pCI‐hDGKk‐transfected Hela cells (hDGKk) was used as antibody specificity control and size marker. Representative images of immunoblots probed with antibodies against the indicated proteins are shown. GAPDH was the loading control. Quantification of Western blots is shown on right. Protein amounts of DGKk are normalized to GAPDH and presented as fold change relative to control. Bars and error bars represent means ± SEM. P value was calculated using an unpaired two‐tailed t‐test. *P < 0.05.
-
BSchematic map of DGKk constructs used for the transfection experiments and subsequent vector preparations. The different domains of the protein are indicated and represented at scale (repeated EPAPE, Pleckstrin Homology PH domain, phorbol ester/diacyl glycerol binding C1 domain, catalytic split C4 a and b domains, putative PDZ binding motive, HA‐tag, gray bars interval 1kB), 5′ and 3′ UTR regions are represented with blue line, 3′UTR not at scale (3.8 kB).
-
C, DImmunoblots and quantification of lysates from Cos‐1 cells transfected with plasmid pCI‐mDGKk‐HA or non‐transfected (NT) and pre‐transfected 24 h before with siRNA control (siC) or against FMRP (siFMR1). GAPDH was used as a loading control. For quantification, the DGKk and FMRP signals were normalized against GAPDH signal and presented relative to the signal for siC‐treated cells (C). Immunoblots and quantification of lysates from Cos‐1 cells transfected with pCI (empty plasmid), pCI‐HA‐∆N‐DGKk, or pCI‐mDGKk‐HA, and pre‐treated with siRNA control (siC) or against FMRP (siFMR1) (D). Quantifications as in C. Each point represents data from an individual culture, and all values are shown as mean ± SEM. P values were calculated using one‐way ANOVA with Tukey's multiple comparison test. ****P < 0.0001; ns, P > 0.05.
Source data are available online for this figure.
