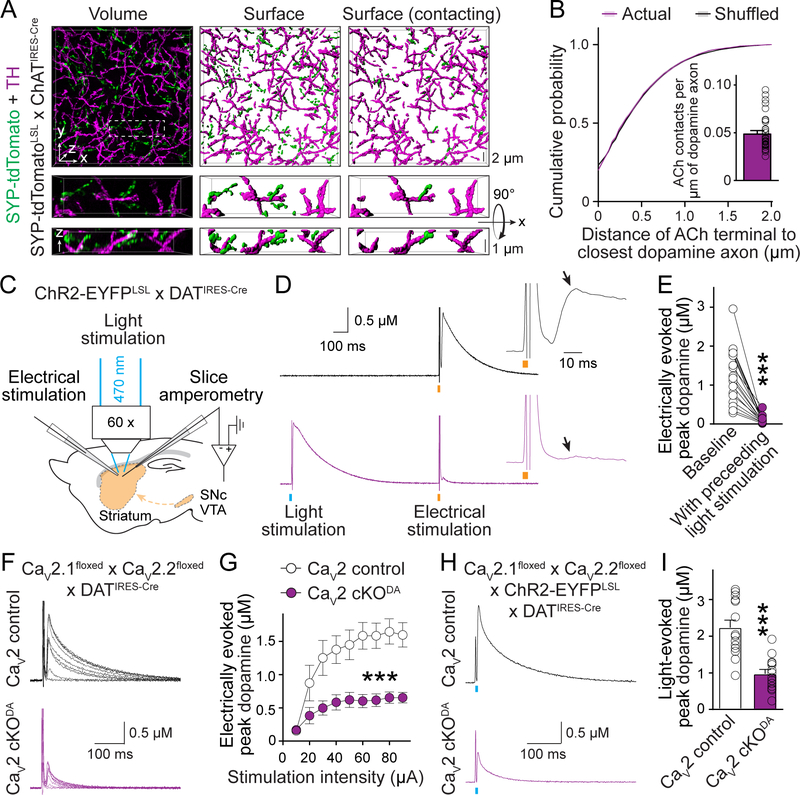
Fig. 2. ACh triggers dopamine secretion through the same release mechanisms as dopamine neuron action potentials.
(A) Example 3D-SIM images of dorsal striatal slices showing dopamine axons (labeled with TH antibodies) and ACh nerve terminals (labeled by crossing Cre-dependent Synpatophysin-tdTomato mice, SYP-tdTomatoLSL, with ChATIRES-Cre mice). Images were obtained by volume rendering of an image stack (left), surface rendering of detected objects (middle), and surface rendering of ACh terminals that contact dopamine axons (right, > 0 voxel overlap). (B) Comparison of the minimal distance of ACh terminals from the nearest dopamine axons. Controls were generated by averaging 1000 rounds of local shuffling and distance calculation of each ACh terminal within 5 × 5 × 1 μm3; n = 5482 objects/33 images/4 mice. (C) Schematic of slice recordings. ChR2-EYFP was expressed in dopamine neurons (by crossing ChR2-EYFPLSL with DATIRES-Cre mice), and dopamine release was measured using amperometry in dorsal striatal slices in the area of light stimulation. (D, E) Example traces (D) and quantification (E) of peak amplitude of the second dopamine release phase (arrows) evoked by electrical stimulation (orange bar) with (bottom) or without (top) a preceding 1-ms light stimulus (blue bar, 1 s before); n = 18 slices/3 mice. (F, G) Example traces (F) and quantification of peak dopamine amplitude (G, second phase) evoked by electrical stimulation in CaV2 cKODA mice (CaV2.1 + 2.2 double floxed mice crossed to DATIRES-Cre mice) and sibling CaV2 control mice; n = 1¾ each (p < 0.001 for genotype, stimulation intensity and interaction; two-way ANOVA; genotype effect reported in the figure). (H, I) Similar to (F, G), but with dopamine release evoked by light stimulation in mice expressing ChR2-EYFP transgenically in dopamine neurons; n = 14/5 each. Data are mean ± SEM; *** p < 0.001; Kolmogorov-Smirnov test for (B); Wilcoxon signed-rank test for (E); Mann-Whitney rank-sum test for (I).

