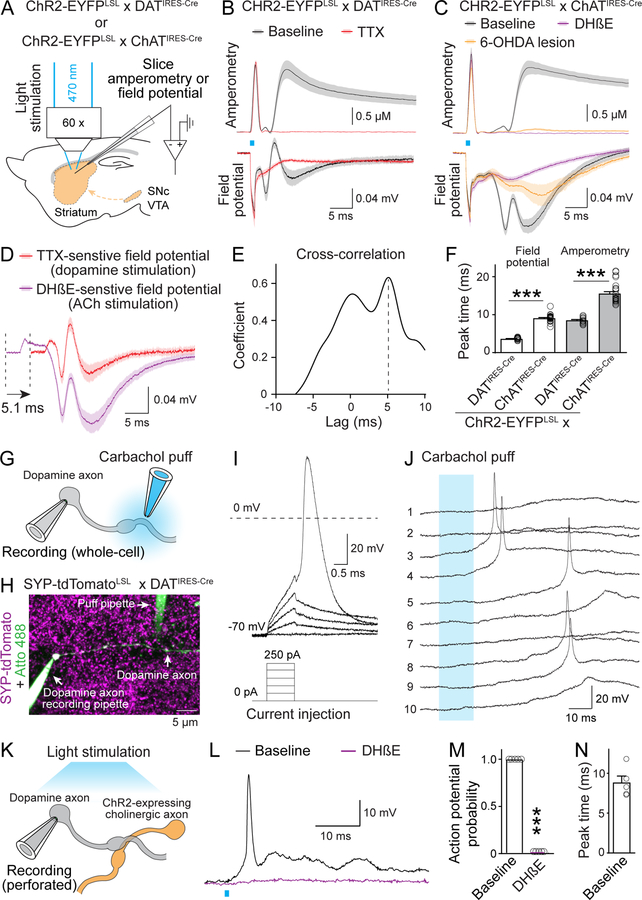
Fig. 3. Activation of nAChR triggers action potentials in striatal dopamine axons.
(A) Schematic of recordings with carbon fiber electrodes in voltage-clamp (0.6 V, amperometric recordings) or current-clamp (no current injection, field potential recordings). (B, C) Average traces of light-evoked dopamine release (top, amperometry) and field potentials (bottom) in brain slices of mice with CHR2-EYFP in dopamine axons (B) or ACh neurons (C). Example traces are in fig. S7, B and C. Recordings were in ACSF (baseline), in 1 μM TTX (B), in 1 μM DHβE (C) or after 6-OHDA injection (C); B, n = 12 slices/3 mice each; C, 25/6 (each) for baseline, 21/6 (amperometry) and 9/4 (field potentials) for DHβE, and 11/6 each for 6-OHDA. (D) Comparison of TTX-sensitive and DHβE-sensitive field potentials (obtained by subtraction; fig. S7, B and C). TTX-sensitive components are right-shifted by 5.1 ms (lag detected in E); n as in (B) and (C). (E) Cross-correlation of TTX- and DHβE-sensitive components shown in (D). (F) Lag of peak response from the start of the light stimulus; n as in (B) and (C). (G, H) Schematic (G) and example two-photon image (H) of direct recording from dopamine axons. Synaptophysin-tdTomato was expressed using mouse genetics in dopamine axons, the recorded axon was filled with Atto 488 (green) through the recording pipette, and the puff pipette contained carbachol and Atto 488. (I, J) Example responses of a dopamine axon to current injections through the whole-cell pipette (I) or to 10 consecutive carbachol puffs (100 μM, numbered, 10-s intervals, J). (K) Schematic of dopamine axon perforated patch recording in mice expressing ChR2-EYFP in ACh neurons. (L to N) Example traces (L), probability of action potential firing (M) and lag of action potential peak times to light onset (N) in dopamine axon recordings with optogenetic ACh interneuron activation before and after 1 μM DHβE; n = 5 axons/3 mice. Data are mean ± SEM; *** p < 0.001; Kruskal-Wallis analysis of variance with post hoc Dunn’s test for (F); Mann-Whitney rank-sum test for (M).

