
FIGURE 3.
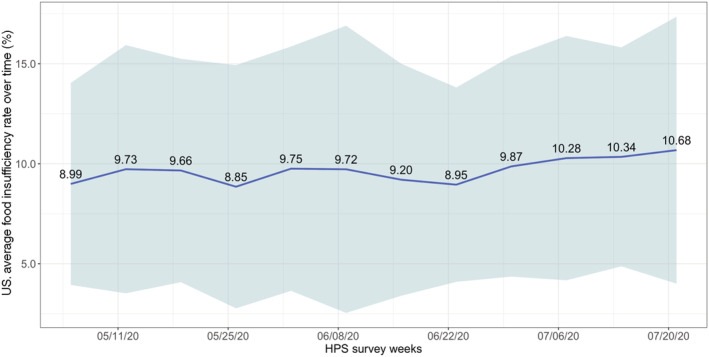
Average (and variation across states in) food insufficiency, the United States. Source: Household Pulse Survey (HPS) and authors' calculation. The blue line represents the averaged values of food insufficiency rates across states, and the shaded area represents the confidence interval with two standard deviations from the mean [Color figure can be viewed at wileyonlinelibrary.com]