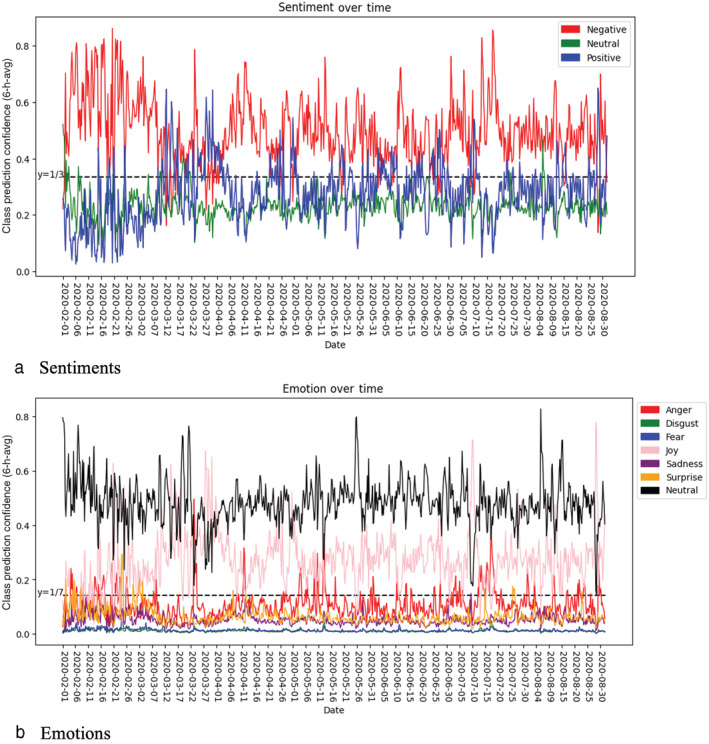
FIGURE 4.

Food‐related Twitter data averaged in 6‐h buckets, the United States. Panel (a) shows the predicted shares of tweets classified into three sentiments, and panel (b) shows the predicted shares of tweets classified into seven emotions. Source: Authors [Color figure can be viewed at wileyonlinelibrary.com]
