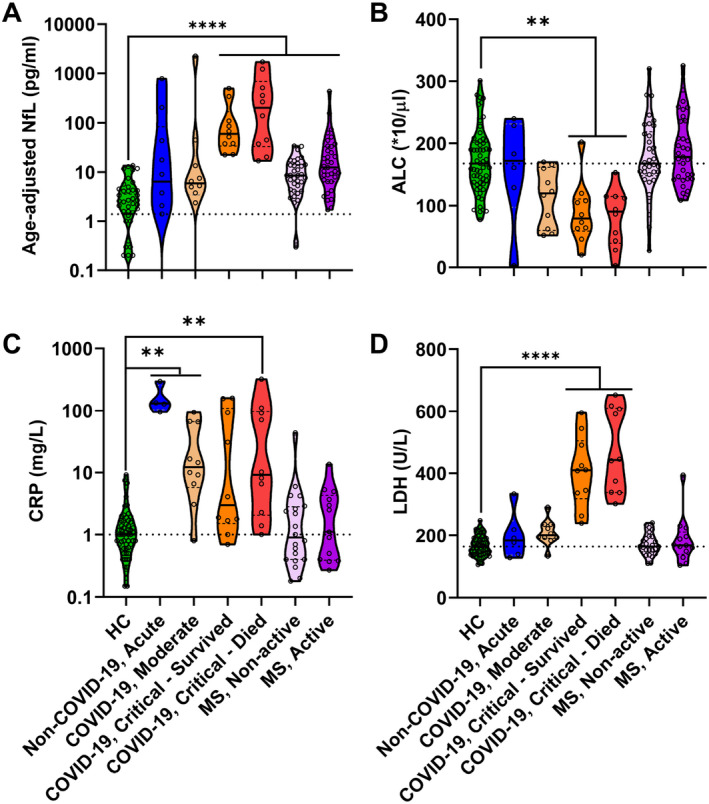
Figure 2.

In cohort 1, serum (A) NfL, (B) ALC, (C) CRP, and (D) LDH levels were compared across HC versus COVID‐19 disease severity and multiple sclerosis disease activity subgroups using Kruskal–Wallis ANOVA; **p < 0.005 and ****p < 0.0001. The dotted line on each plot indicates the median of HC. NfL, neurofilament light chain; ALC, absolute lymphocyte count; CRP, C‐reactive protein; LDH, lactate dehydrogenase; COVID‐19, coronavirus disease 19; HC, healthy controls. [Colour figure can be viewed at wileyonlinelibrary.com]
