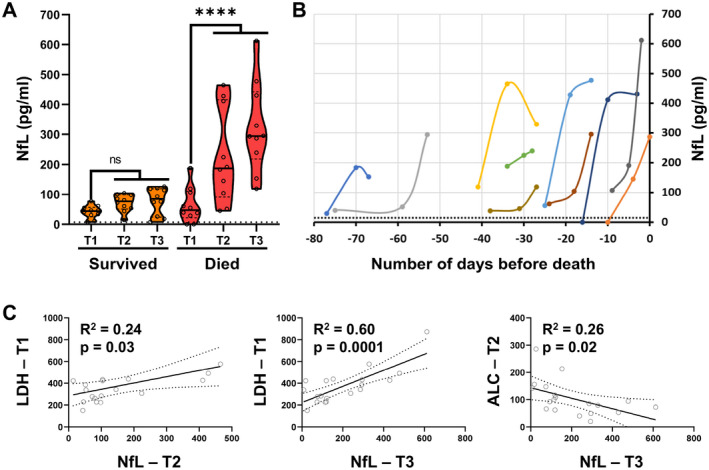
Figure 3.

In cohort 2, (A) plasma NfL levels at 3 different time points (T1, T2, and T3: collected on average at 5‐to‐10‐day intervals, within 30 days of hospitalization) in critically ill COVID‐19 patients were compared (survived vs. died) using Kruskal–Wallis ANOVA; ****p < 0.0001. The dotted line indicates the median of the HC. (B) Longitudinal plasma NfL levels in critical COVID‐19 patients who died, plotted with respect to the number of days before death. Each line represents data from an individual patient. The dotted line represents upper limit in HC (i.e., mean + 3 × SD = 20 pg/mL). (C) Correlations between systemic biomarkers' measurements at earlier time points (T1 and 2) and NfL measurements at later time points (T2 and T3) were assessed using linear regression analysis. R 2 and p‐value are represented on respective correlation plots. The dotted line indicates a 95% confidence interval. NfL, neurofilament light chain; COVID‐19, coronavirus disease 19; HC, healthy controls. [Colour figure can be viewed at wileyonlinelibrary.com]
